Tips for making the shift to new charting “metrics” using online resources.
Modern technology and the transition from raster charts to Electronic Navigation Charts (ENC) has fundamentally changed how we prepare for fishing trips and navigate our boats. The wealth of information available for immediate use is as overwhelming as it is helpful.
Yet, as technology moves forward, older technologies and data sets sometimes have valuable features and data that are lost to “progress” or are made obsolete by new electronic formats.
With the continuing transition from raster to electronic charts, the following discussion reviews the status of the Coast Survey’s Automated Wreck and Obstruction Information System (AWOIS) and the National Oceanic and Atmospheric Administration’s (NOAA) Bathymetric Data Viewer (BDV).
Hang Logs
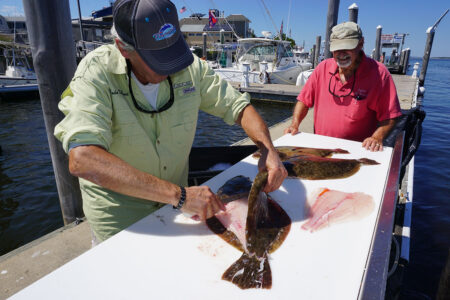
The AWOIS database is a valuable online resource for wreck research and for locating, identifying, and characterizing bottom structure as fishing destinations. For example, “hang” reports of commercial fishing gear occasionally reveal the location of previously unknown wrecks or known wrecks whose position was uncertain or unknown. A case in point, the Nuphar at the Townsends Inlet outer bar was rediscovered as the result of an AWOIS hang report. (see Ghost Of Nuphar: A Townsend Inlet Riddle published in the New Jersey, Delaware Bay edition of The Fisherman in February of 2020). AWOIS is, however, a casualty of progress.
The AWOIS database is no longer being updated. Fortunately, it’s being maintained as an online resource, and is accessible using the Coast Survey’s Wreck and Obstructions Map Preview (just type “Coast Survey’s Wreck and Obstructions Map Preview” into Google search or go to https://wrecks.nauticalcharts.noaa.gov/viewer.) This Map Viewer displays both AWOIS and ENC wreck files. There are thousands of files – the sheer number of shipwrecks is mind boggling! As a hedge against future changes in availability, I downloaded a copy of the entire AWOIS dataset into my electronic packrat file.
Much of the AWOIS data – although not complete and known to have some errors – is nevertheless robust. Wreck histories and details from National Ocean Service Descriptive Reports (DR) that document the results of hydrographic surveys are a great aid to scouting wrecks for fishing potential. On the other hand, ENC wreck files contain basic location data. To learn more, it’s necessary to dig through individual DRs which are directly accessible using the BDV, or access the “ENC Viewer”. The latter is a primary online resource for ENC data which is much more detailed than the AWOIS ENC files.
Also, it’s possible to toggle the chart display between feet and meters. How to access and manipulate the ENC Viewer’s multiple robust data layers is well beyond the scope of this discussion, but the resource is not one to be overlooked.
Switching To Metrics
Primary online resources for my fishing reef research are the Bathymetric Attributed Grid (BAG) Color Shaded Relief and Digital Elevation Models (DEM) Color Shaded Relief imaging layers available using the BDV. Placing the see-through raster chart with the wreck and obstruction markings over the BAG, DEM, and combined BAG and DEM images enabled finding charted, uncharted, and inaccurately charted structures and accessing the pertinent DRs.
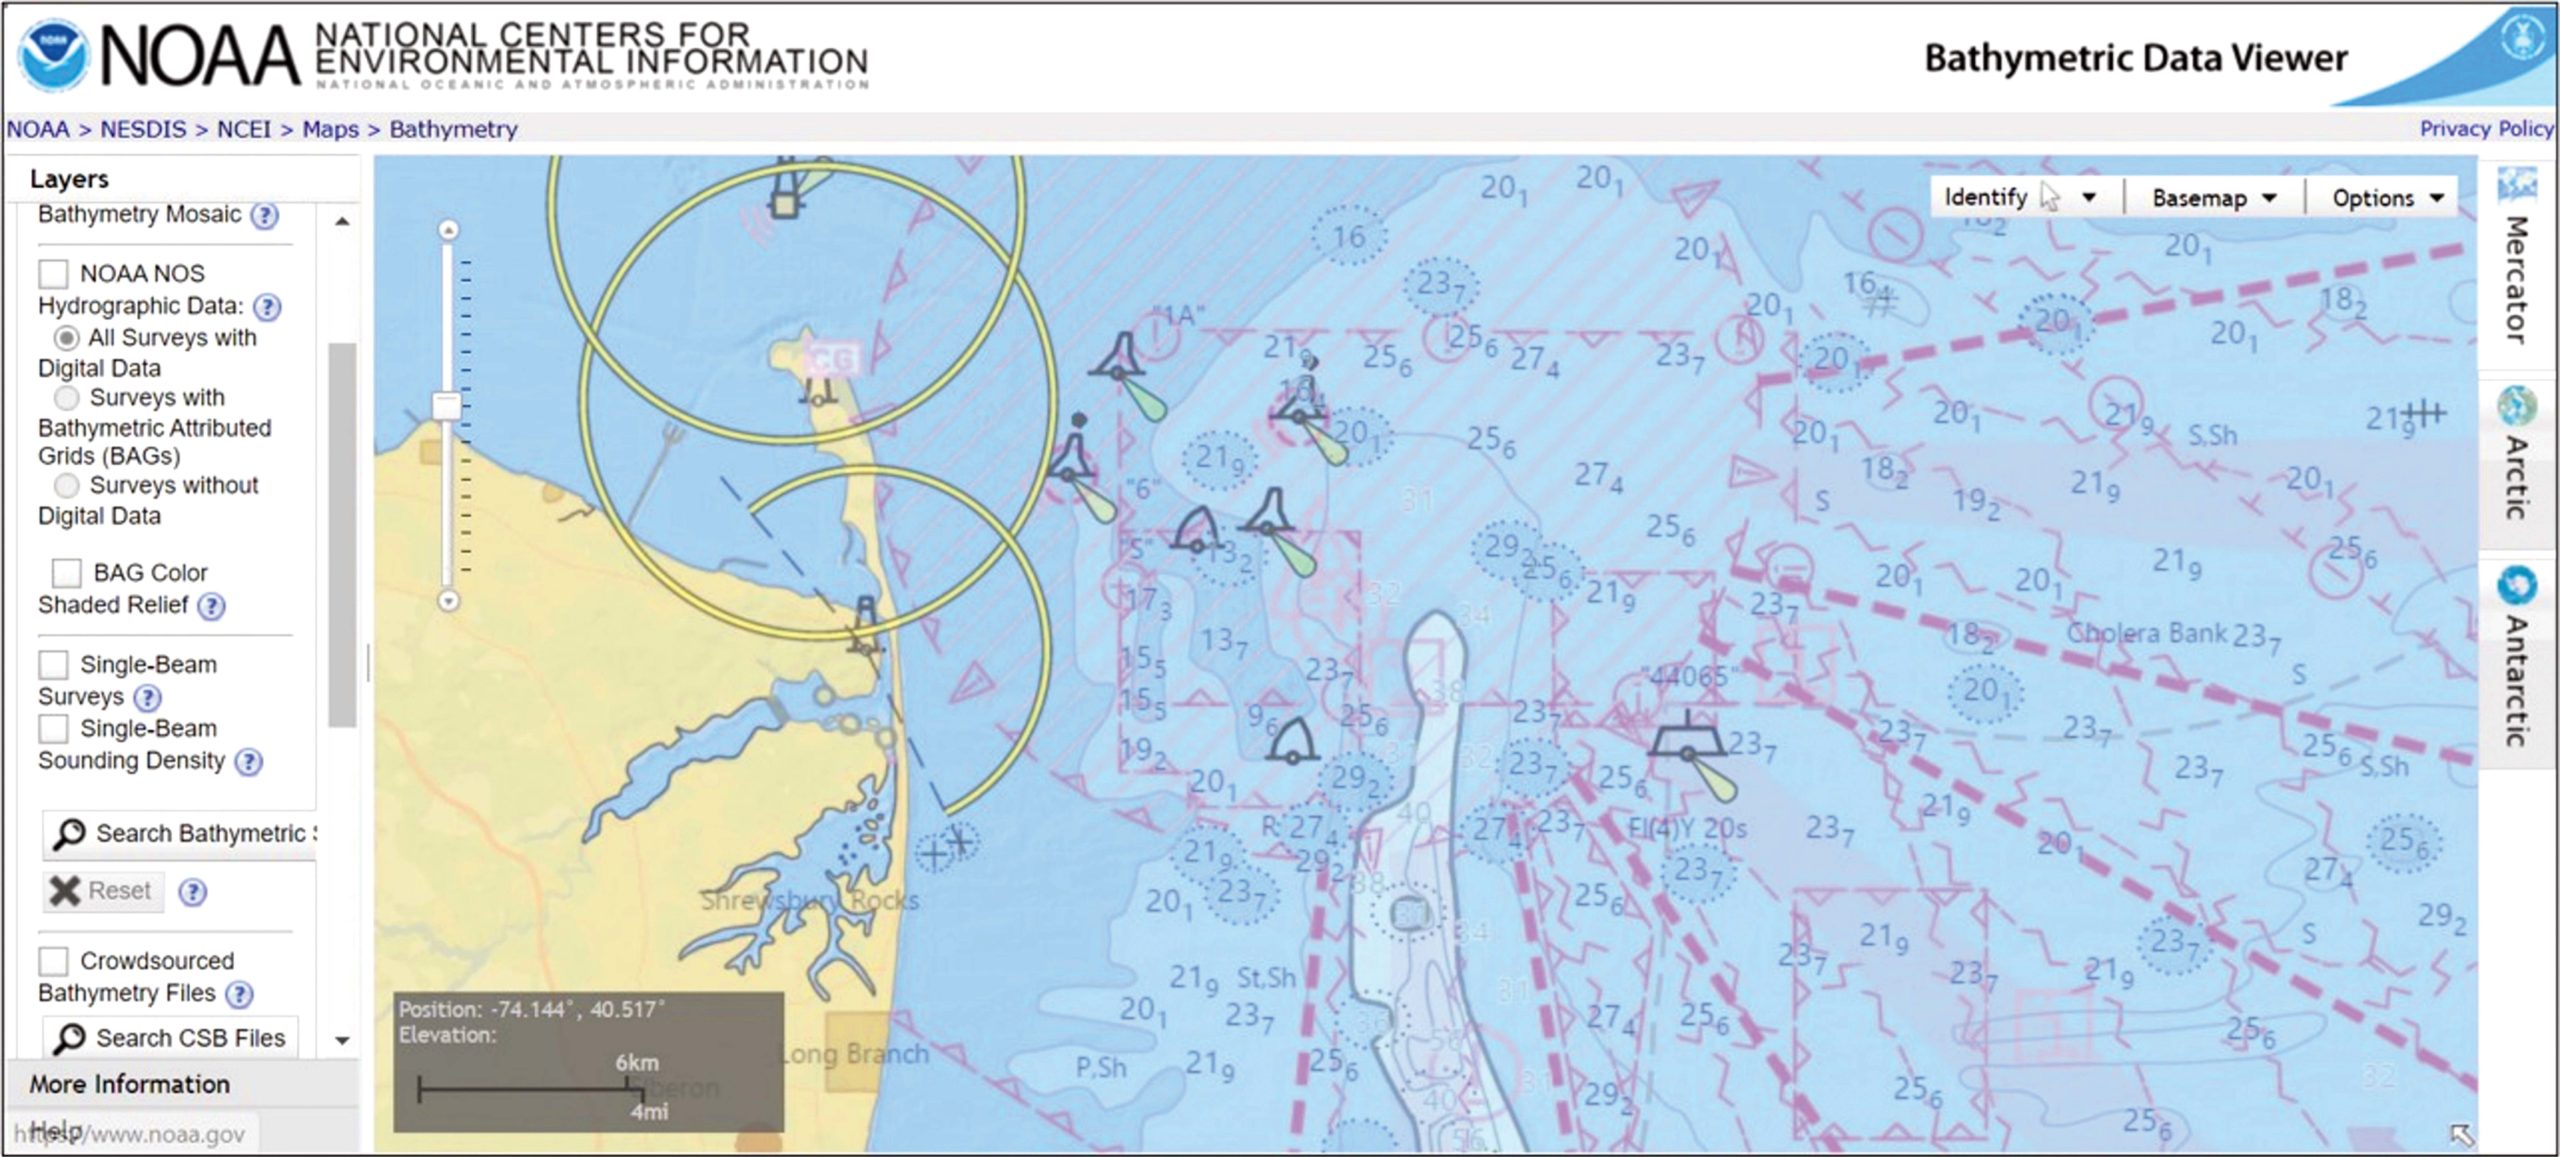
Until recently, the BDV had a see-through raster nautical chart with wreck and obstruction symbols. This longstanding charting practice visually flagged these features, thereby facilitating their recognition by chart users, further investigation, and DR selection. That practice changed in September 2021 when the see-through chart layer was converted to ENC charts (CHART 1).
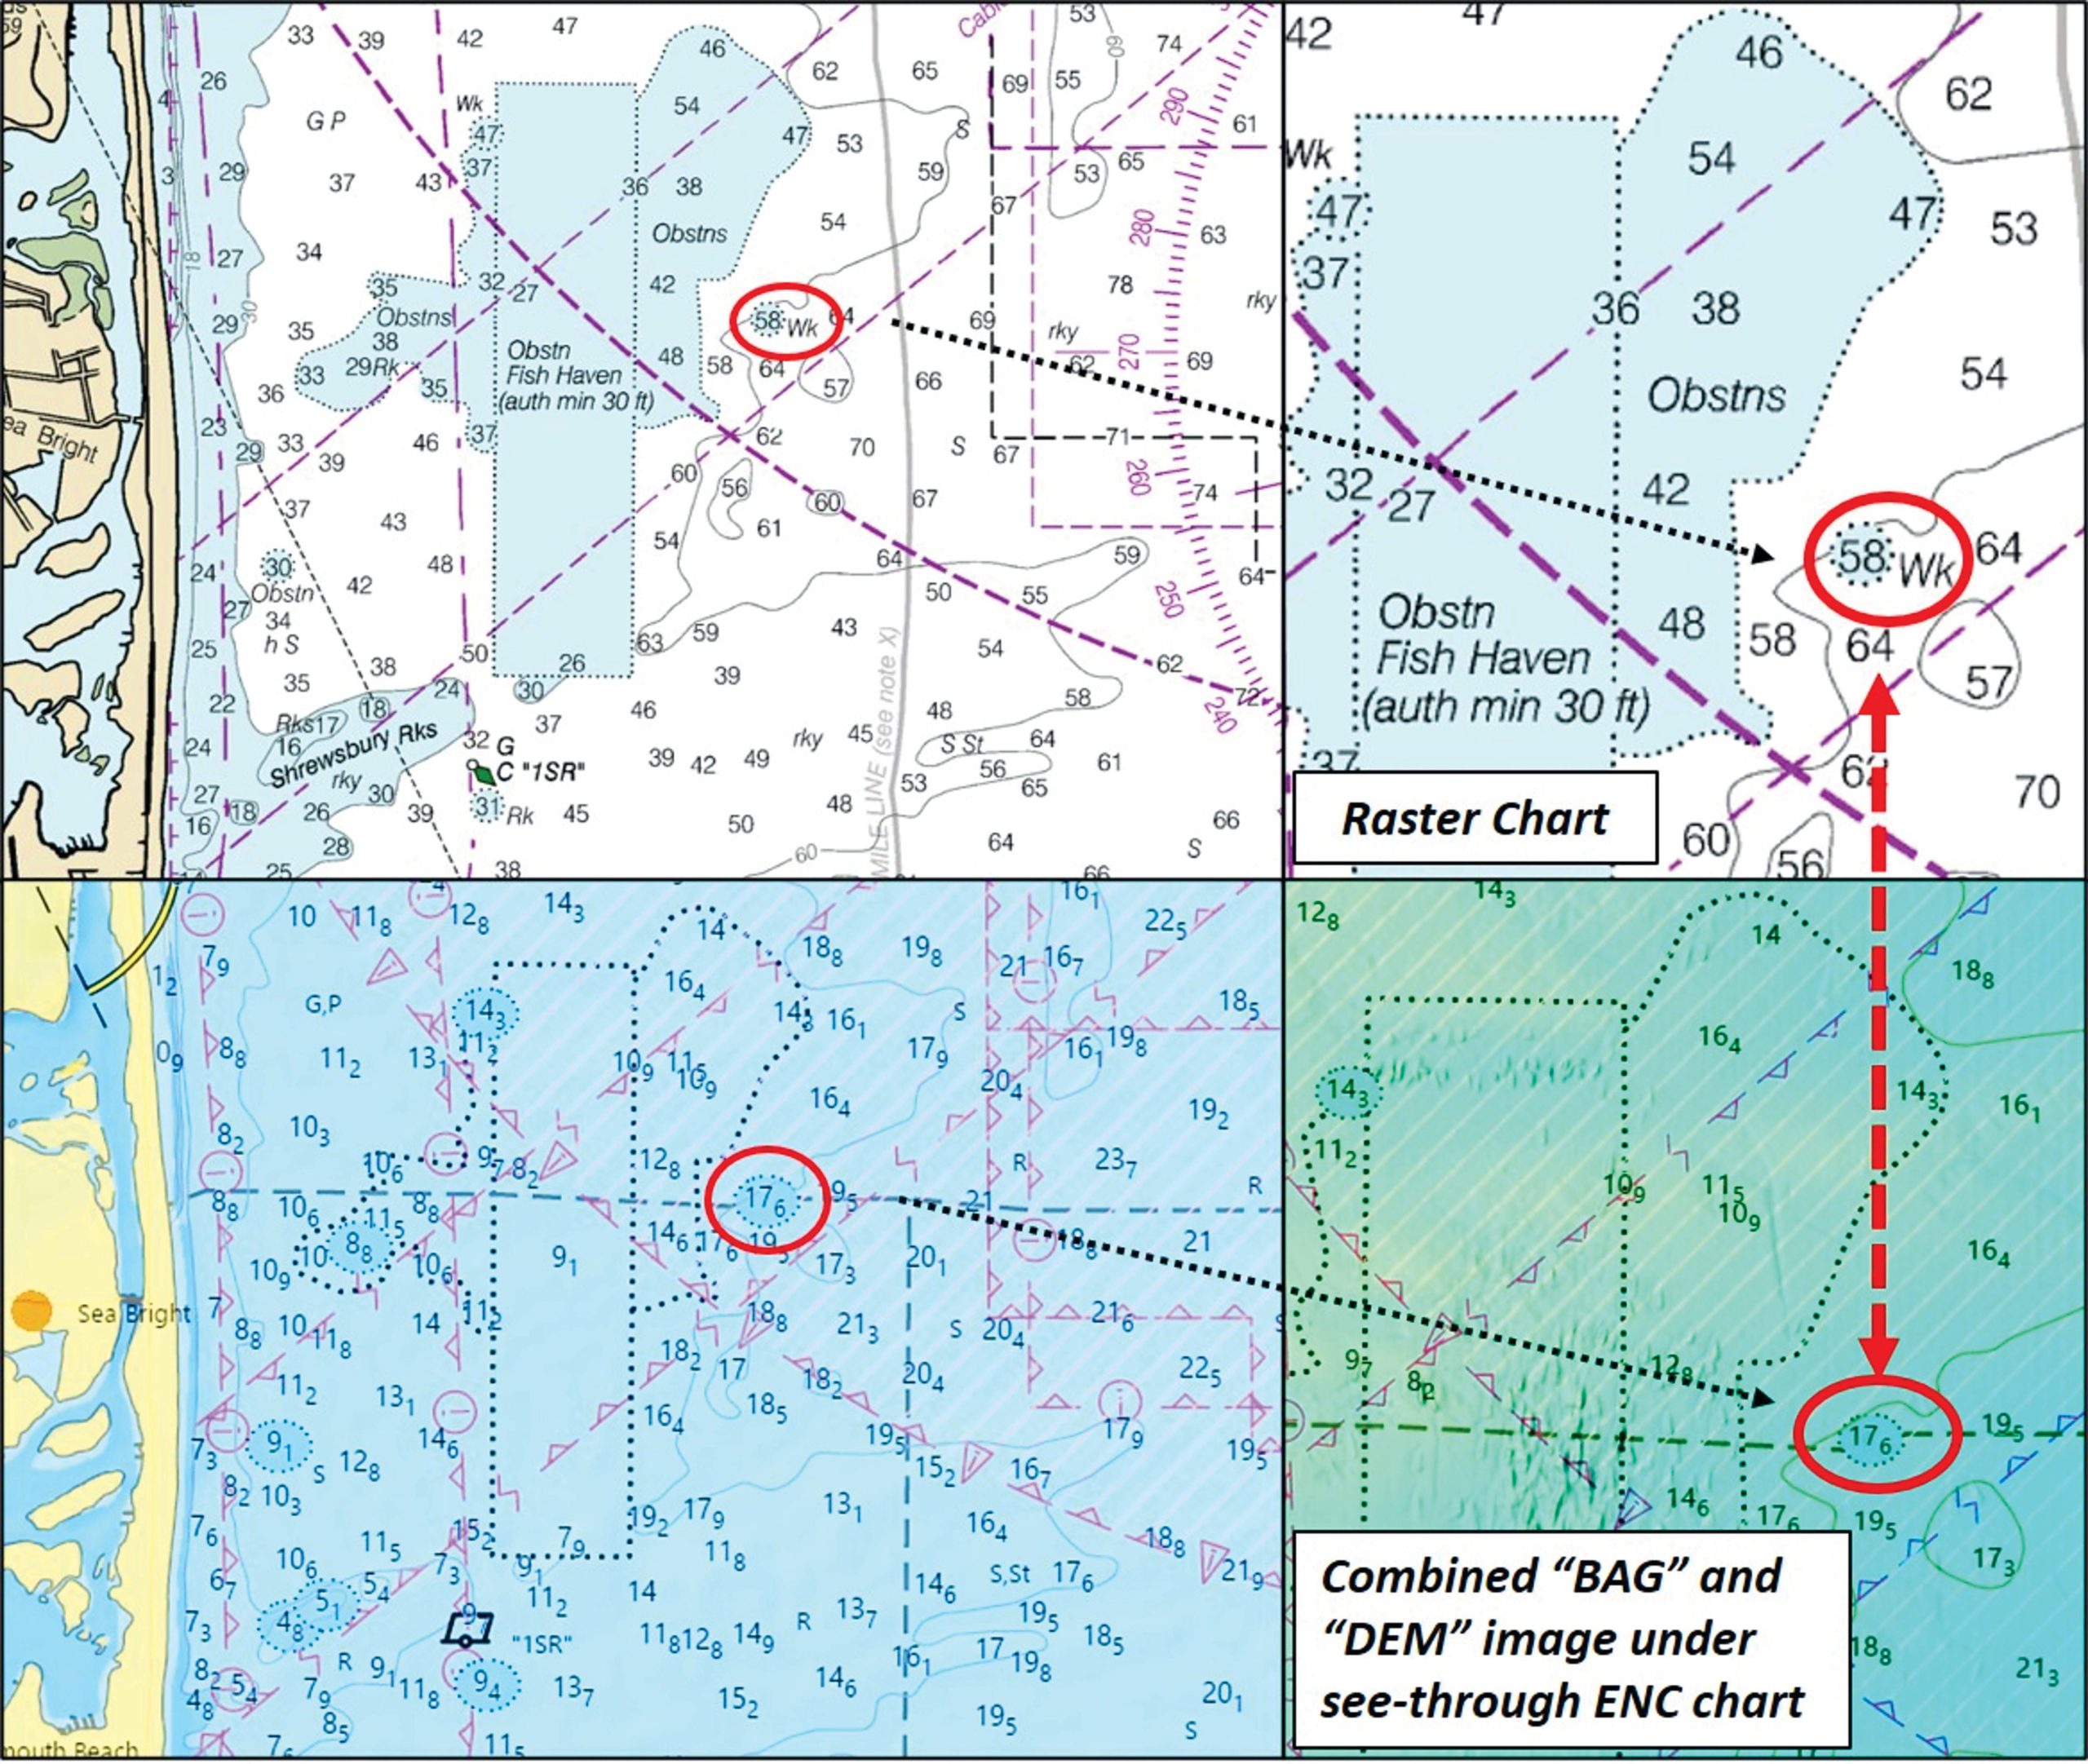
By looking at CHART 2, you can see the display difference between raster and ENC format as applied to the BDV. (The ENC image brightness and contrast in the illustration were adjusted for compatibility with the print format.) We’ll look more closely at the 58-foot wreck highlighted by the red circle to further illustrate the change in display and what you need to look for when using the BDV. Also, note that depth shifted from feet to meters.
So, what was once a 58-foot least depth wreck is now a 17.6-meter wreck when using the BDV; the metric system has been used in hydrographic survey work for some time, although U.S. navigation charts have traditionally used the Imperial system of measurement. Unlike the ENC Viewer, the ability to toggle between feet and meters is currently not available in the BDV application.
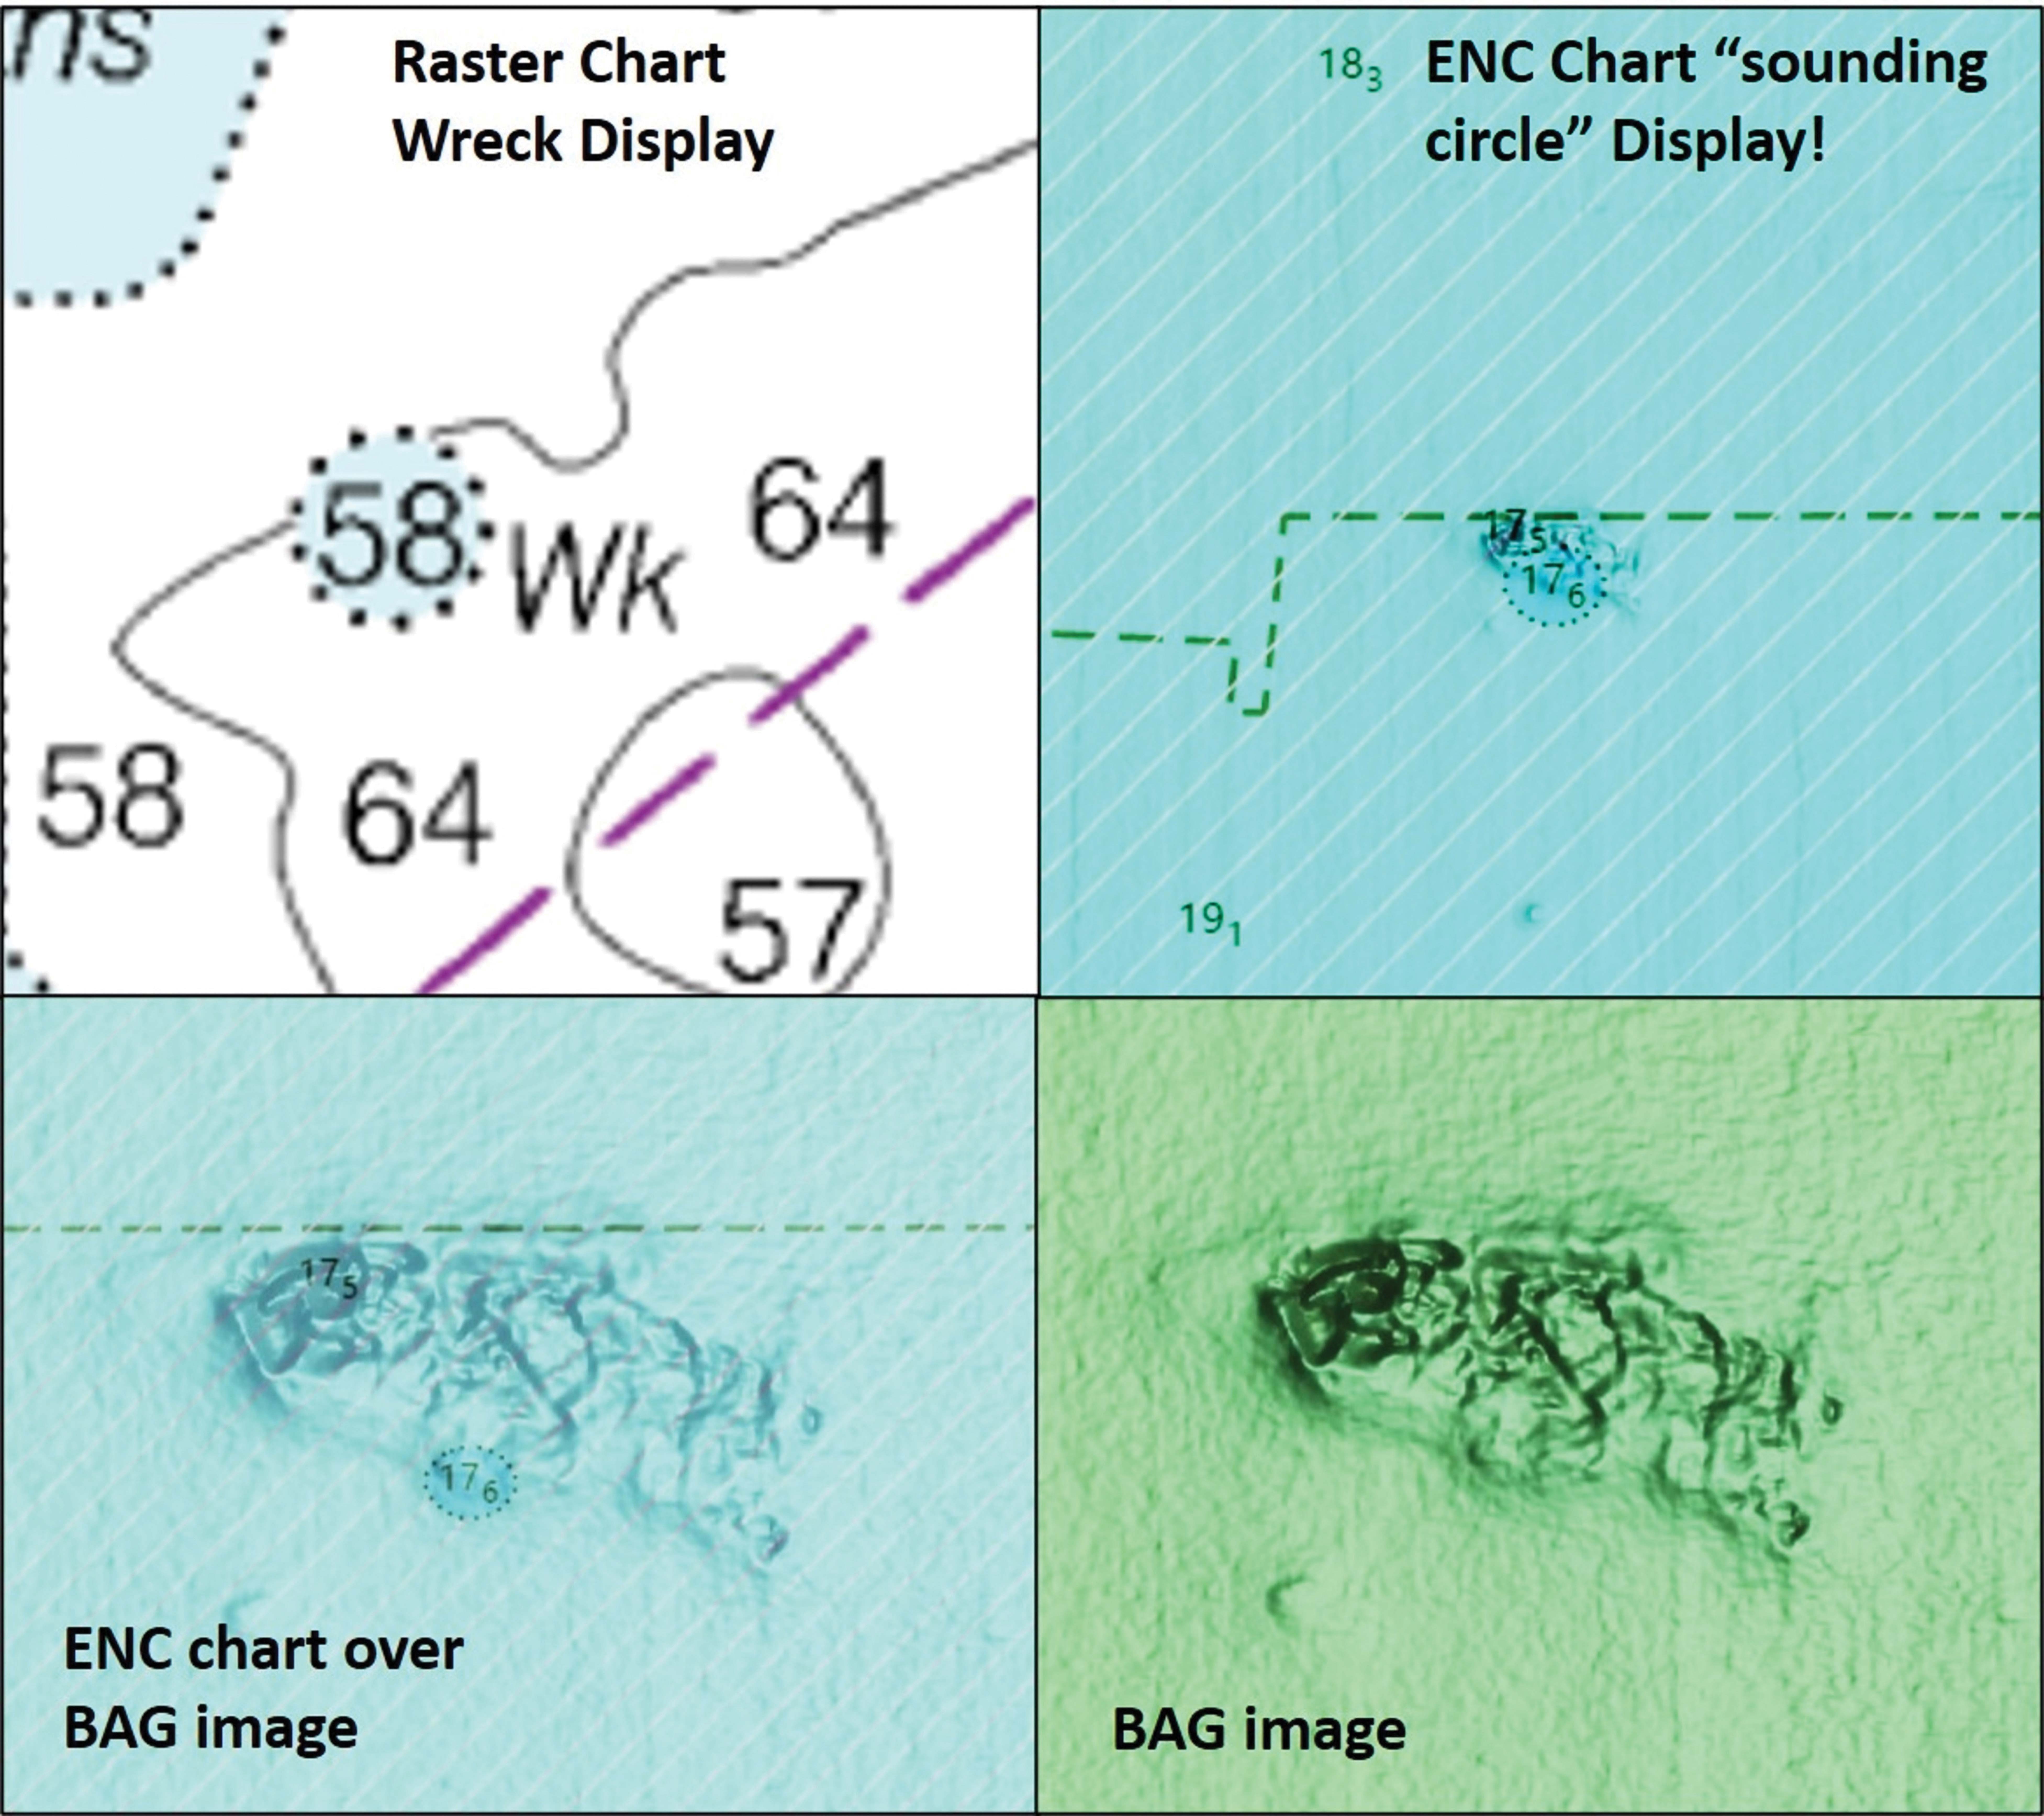
With the conversion of the BDV see-through chart to ENC format, most wreck and obstruction symbols are no longer displayed, replaced instead by nondescript sounding “circles”, as illustrated by CHART 2. The application also had additional “BAG” Color Shaded Relief data uploaded and the chart layer now can remain displayed at all zoom levels, both positive developments.
The downside is that the current ENC format makes it more difficult to identify wreck locations in the absence of specific visual nomenclature to draw user attention to them. However, the NOAA staff advised that further updates to the ENC chart service layer are in development with a target release date of late 2021. Prospective updates are anticipated to provide more of the feel of raster charts, including wreck symbols, albeit it without the least depth soundings. In the meantime, raster chart images including these data are available as a data layer in the ENC Viewer.
Focus On Structure
CHART 3 provides a zoomed-in look at the 58-foot wreck. I knew it was there from my previous use of the BDV’s raster chart overlay, and also the use of the AWOIS map viewer, which, at least for now, still has a raster chart base layer. Currently, the BDV doesn’t have a “no basemap” white background layer. The images displayed by the BDV are darker and more washed out than those shown in the graphic, which were enhanced so that the sounding circle was clearly visible. The washout effect occurs because the chart is over a colored basemap or other data layer such as “BAG” imaging, and the layered colorations sort of blend together.
The availability of the see-through chart at all zoom levels is helpful for zeroing in on bottom anomalies. However, the size of the sounding circle varies by the extent of the zoom. The sounding number is the recorded least depth from DRs, which is placed at the reported coordinates. Many of these coordinates were based on navigation technologies with greater error factors than differential GPS. In fact, for some wrecks and obstructions, the feature isn’t under the circle. So, the actual least depth spot on the feature may very well be offset from where shown. NOAA is aware of this scaling issue for future technology updates.
The Bathymetric Data Viewer remains a valuable armchair scouting aid. As the transition from raster to electronics charting continues, those of us who use the BDV will just have to adjust. One approach which I use is to check the AWOIS and ENC mapped wrecks and obstructions and then correlate them with the ENC sounding circles. I’ll switch between windows or place them side-by-side in separate windows. Another approach is to run the BDV and ENC Viewers simultaneously in separate side-by-side windows. For power users with multiple screens, the BDV, ENC, and AWOIS Viewers can be displayed simultaneously. Most of the time, I’ll toggle between screens and scale up the display to make it easier to view with old eyes!
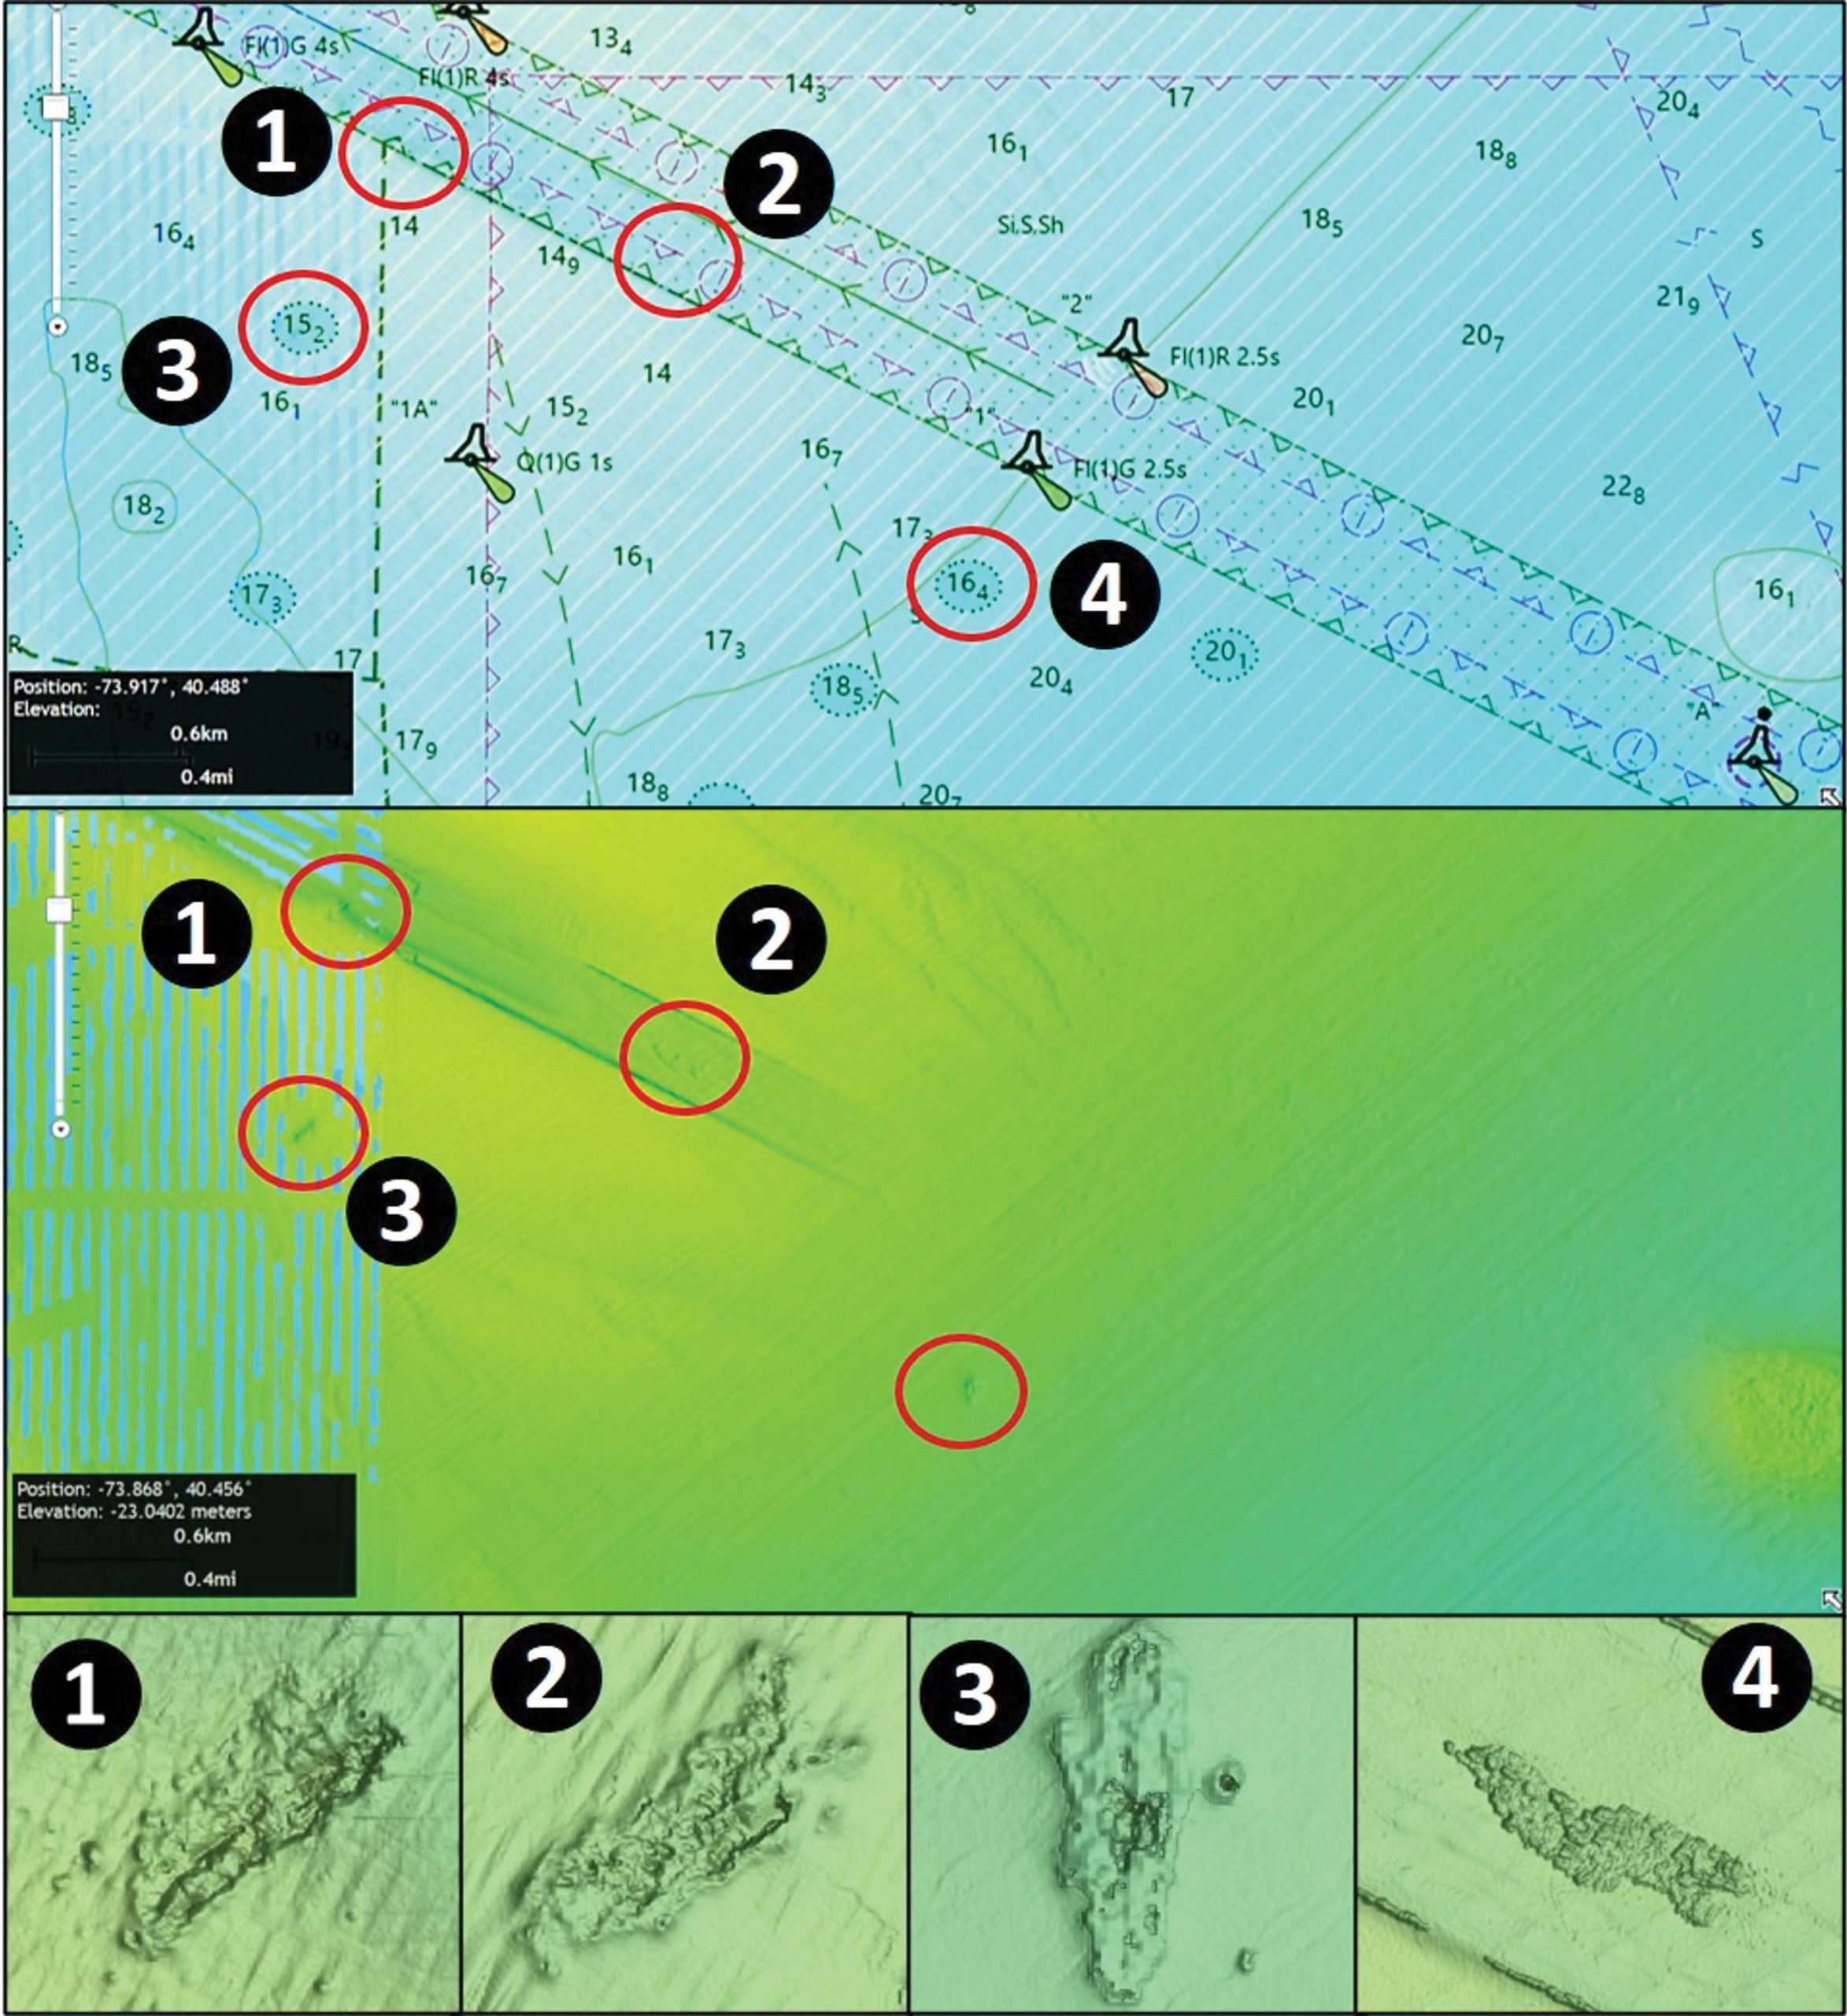
Also, when using the ENC see-through chart, I’ll check each shoal-like sounding circle and visually scan under the chart with the BAG layer displayed for uncharted anomalies such as the natural reef and uncharted obstruction such as Sites 1 and 2 on CHART 4. Also, note that the little shoal shown in the graphic is charted as an obstruction on raster charts. Ironically, charted data in the displayed layer have become less precise while navigation electronics have improved to enable near pinpoint positioning!
Wayne Young is a former manager of the Maryland artificial reef program for Chesapeake Bay waters. He is the author of “Chesapeake Bay Fishing Reefs: Voyages of Rediscovery” available on Amazon.com. His Facebook page is Chesapeake Bay Fishing Reefs. Charts and bathymetry images are processed screenshots from the National Oceanic and Atmospheric Administration’s Bathymetric Data Viewer which can be found at https://maps.ngdc.noaa.gov/viewers/bathymetry or simply by Googling “NOAA Bathymetric Data Viewer.”