Using free online resources can shed new light on your favorite fishing locations.
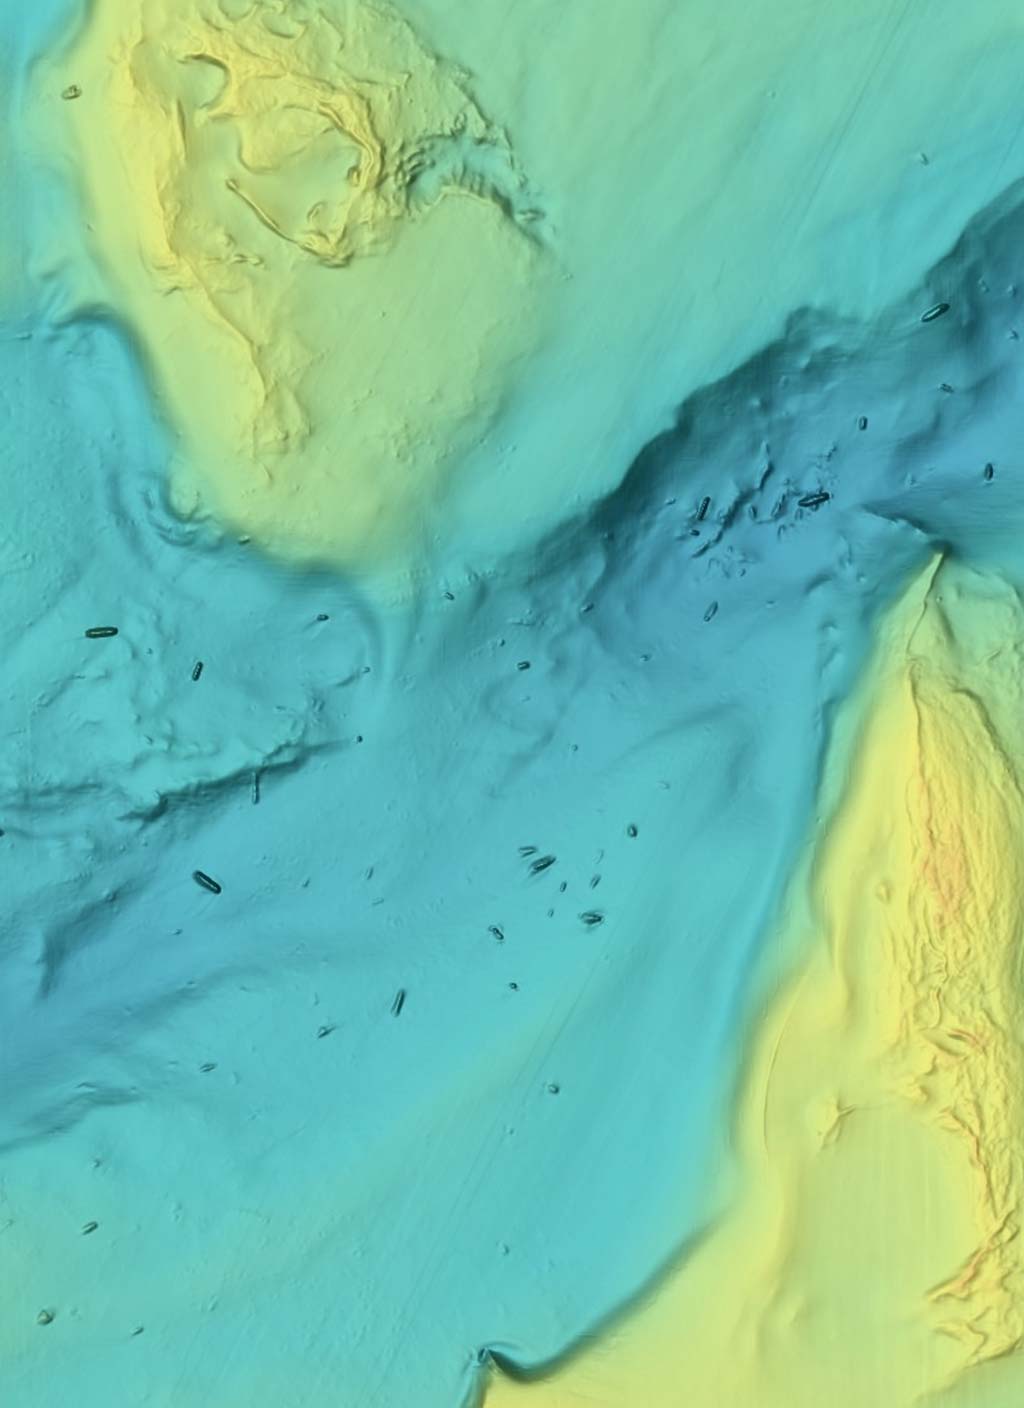
Last year at my “day job” as a fisheries and environmental scientist, while researching depth data near an artificial reef south of Long Island, I came across what felt like an incredible discovery – completely free, publicly available, super high resolution elevation data that showed the seafloor in mind-blowing detail. I could see individual boulders, patches of cobble, clearly identify whether a wreck was a barge with squared off bow or a ship with a more streamlined form, I was even able to see the score marks in the mud left by oyster dredges. Following this discovery, I spent what I can only describe as a concerning amount of time poring over the seafloor looking at places I have fished my whole life in new detail and finding new areas to target.
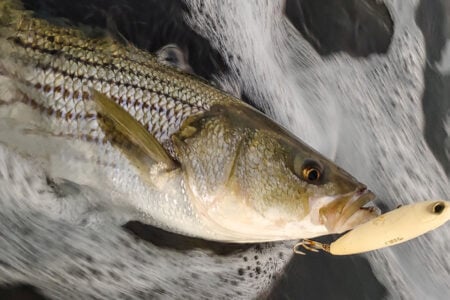
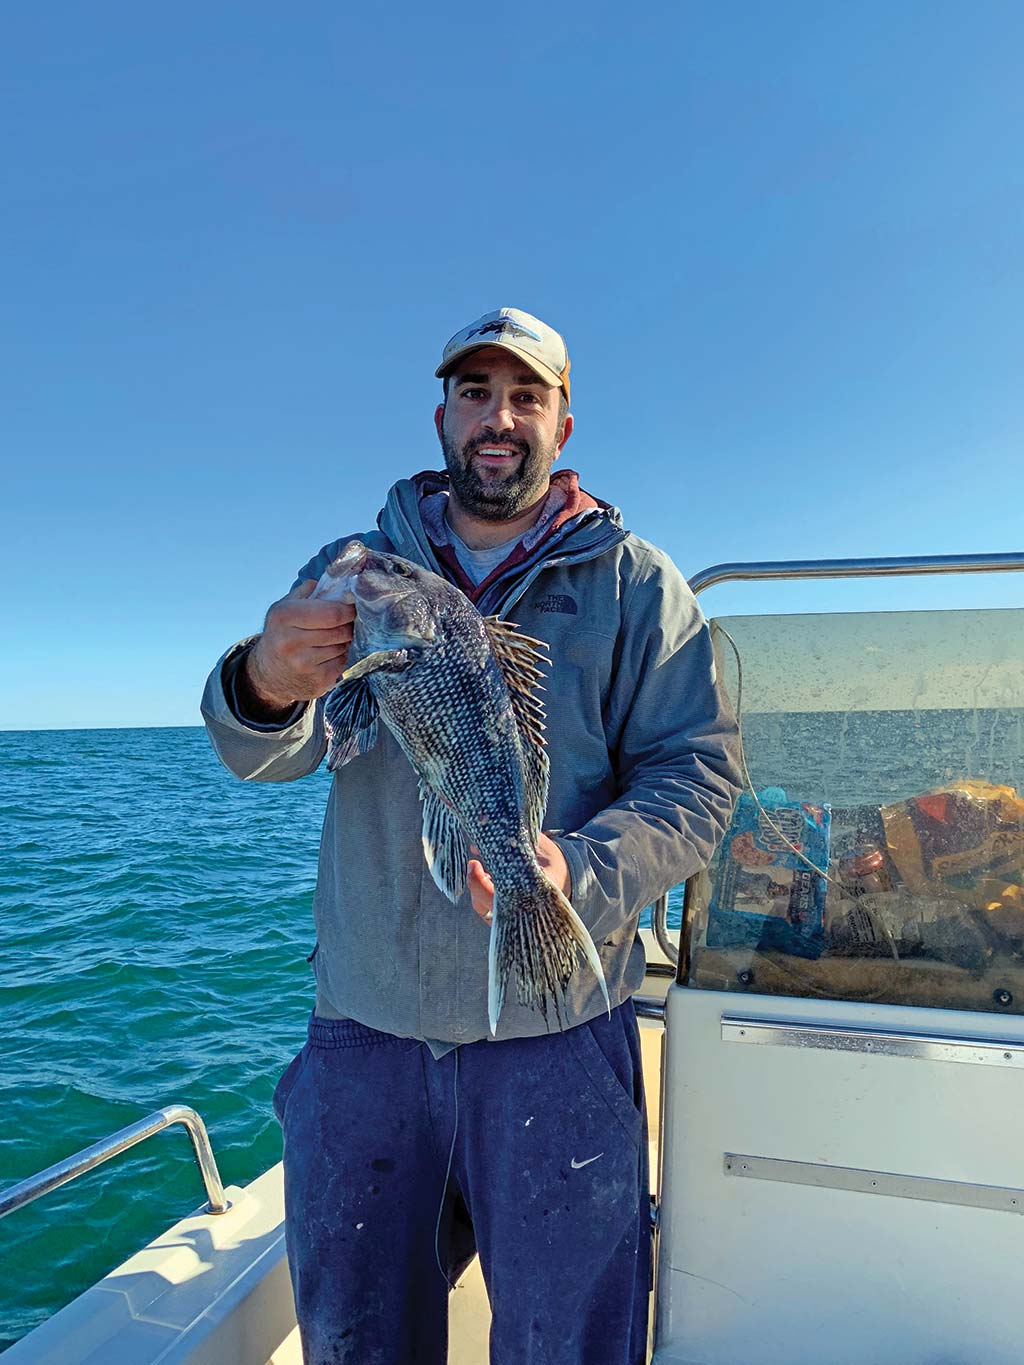
My first trip guided by this new tool was to an unnamed cluster of boulders in about 50-feet of water that I found while poring over the sea floor imagery. The unnamed area was the size of a football field surrounded by miles of featureless bottom, and a spot that I never knew existed. Anticipation was high as the boat came to a stop and we prepared to lower our jigs to the bottom in hopes of catching sea bass and trophy fluke. As our drift brought us closer to the structure, the depth sounder showed the jagged bottom and began to light up with fish. Moments later, my bucktail stopped in its tracks and I came tight to a personal-best sea bass. After placing the fish in the cooler I looked around and saw there was not another boat in sight, and the deep satisfaction of a plan coming together set in. Since then I have made regular use of this public dataset when planning fishing trips and found a number of different ways to access it and bring it on the water.
What Is It?
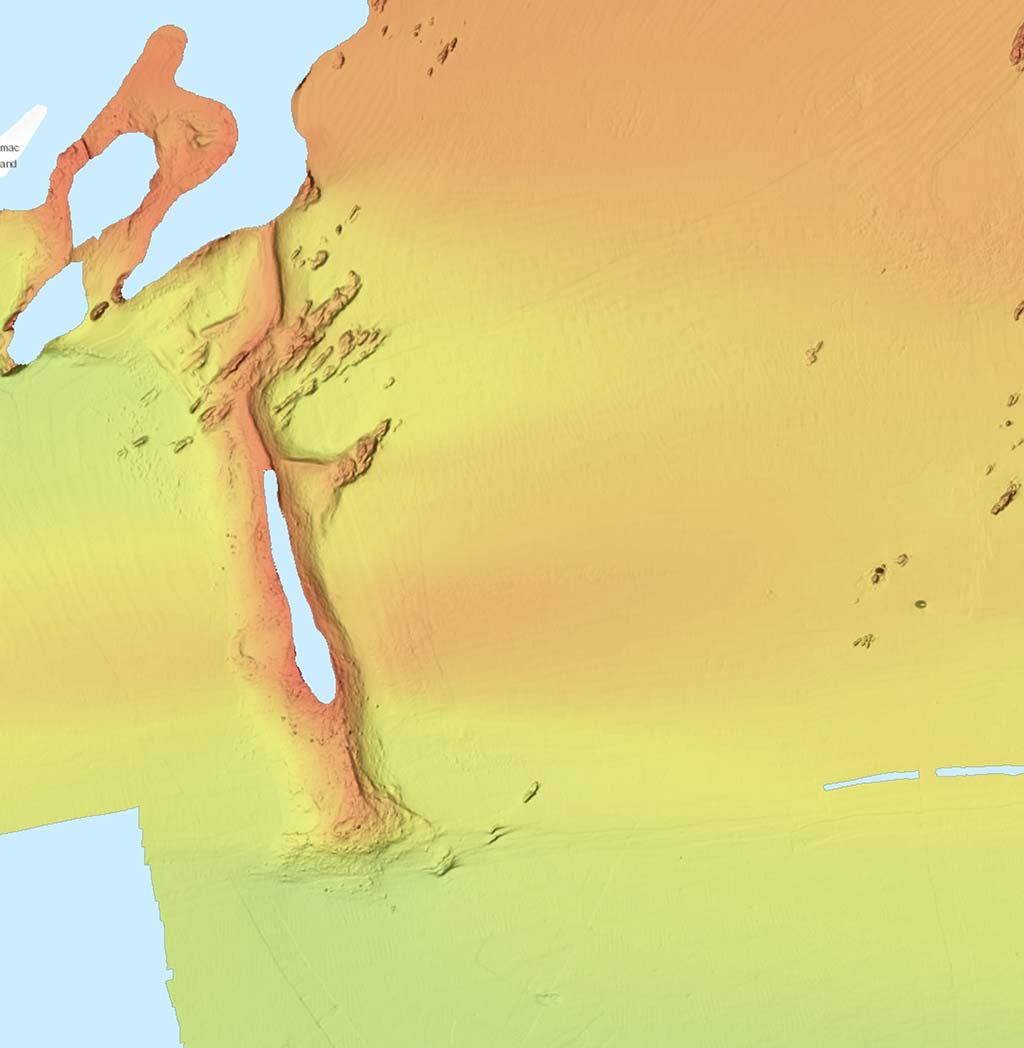
So, what exactly is the wondrous resource that I stumbled upon? It turns out I came across the Bathymetric Attributed Grid (BAG) sea floor elevation dataset; BAG is a type of digital file format, used to store the seafloor elevation dataset produced by the National Oceanic and Atmospheric Administration (NOAA) National Ocean Service. Large portions of the nearshore area off New England and Long Island have been surveyed with 1 meter or greater resolution. The elevation data is of high enough resolution that features such as reefs, boulders, and ship wrecks show up in highly-detailed “birds eye view” imagery that is much more intuitive than traditional navigation charts or contour lines. The survey coverage does have some gaps, but the majority of areas anglers target in the Northeast are covered. This data was collected to support ocean planning, mapping, and scientific surveys but is of great use to anglers.

What Can It Do?
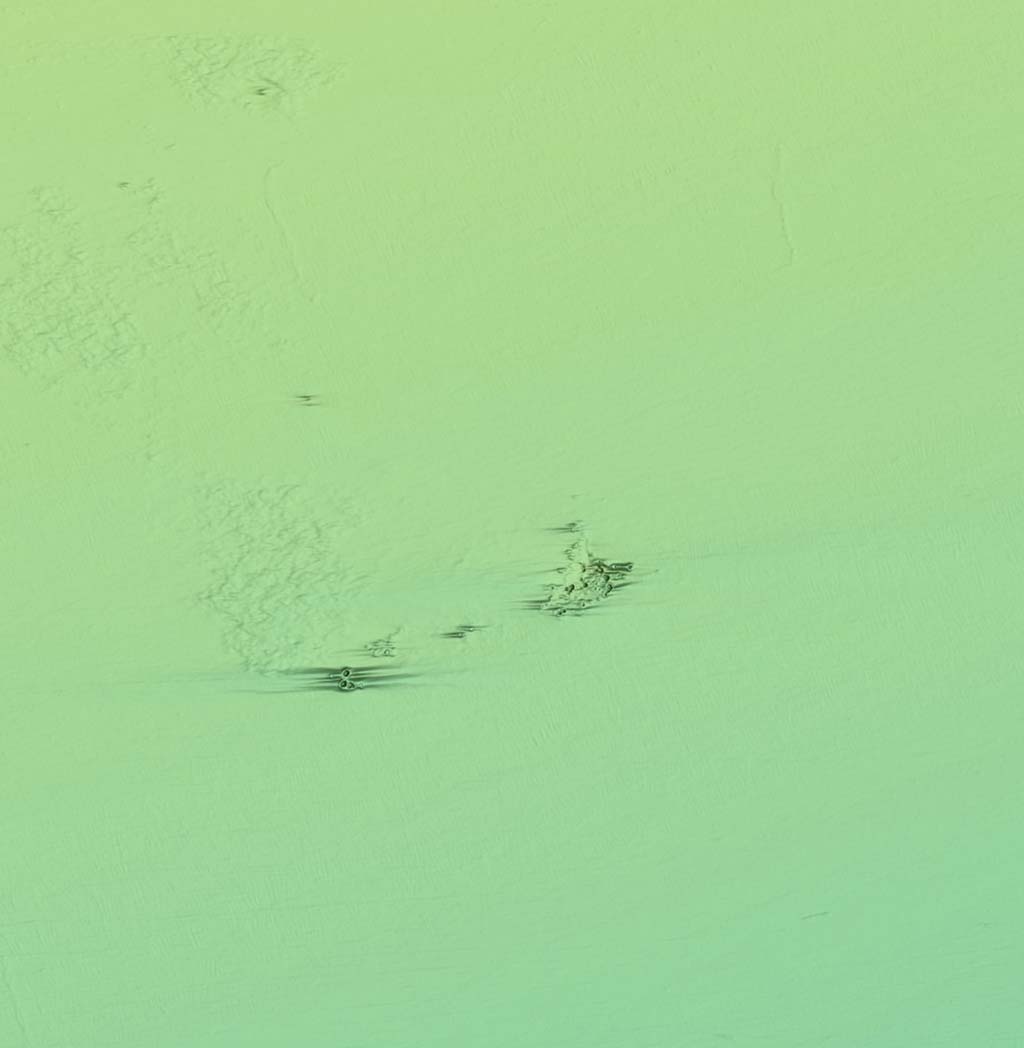
The biggest difference between the BAG elevation data and traditional charts, is the level of visual detail, which allows anglers to see what the structure consists of instead of simply how deep it is. As an example, a traditional navigation chart may indicate that there is a drop off or a depth change by showing the depth at individual sounding locations and in some instances a general outline around a reef or other feature. More recent charts with contour lines may allow you to see how quickly the depth changes and provide a more detailed outline of the feature. The BAG elevation data allows you to do both of those things while also seeing what the structure consists of in detail. A smooth muddy hump or drop off is a lot less interesting than a depth change littered with rock. This program is a great way to find small boulder piles and other areas of complex structure that are off the beaten path.
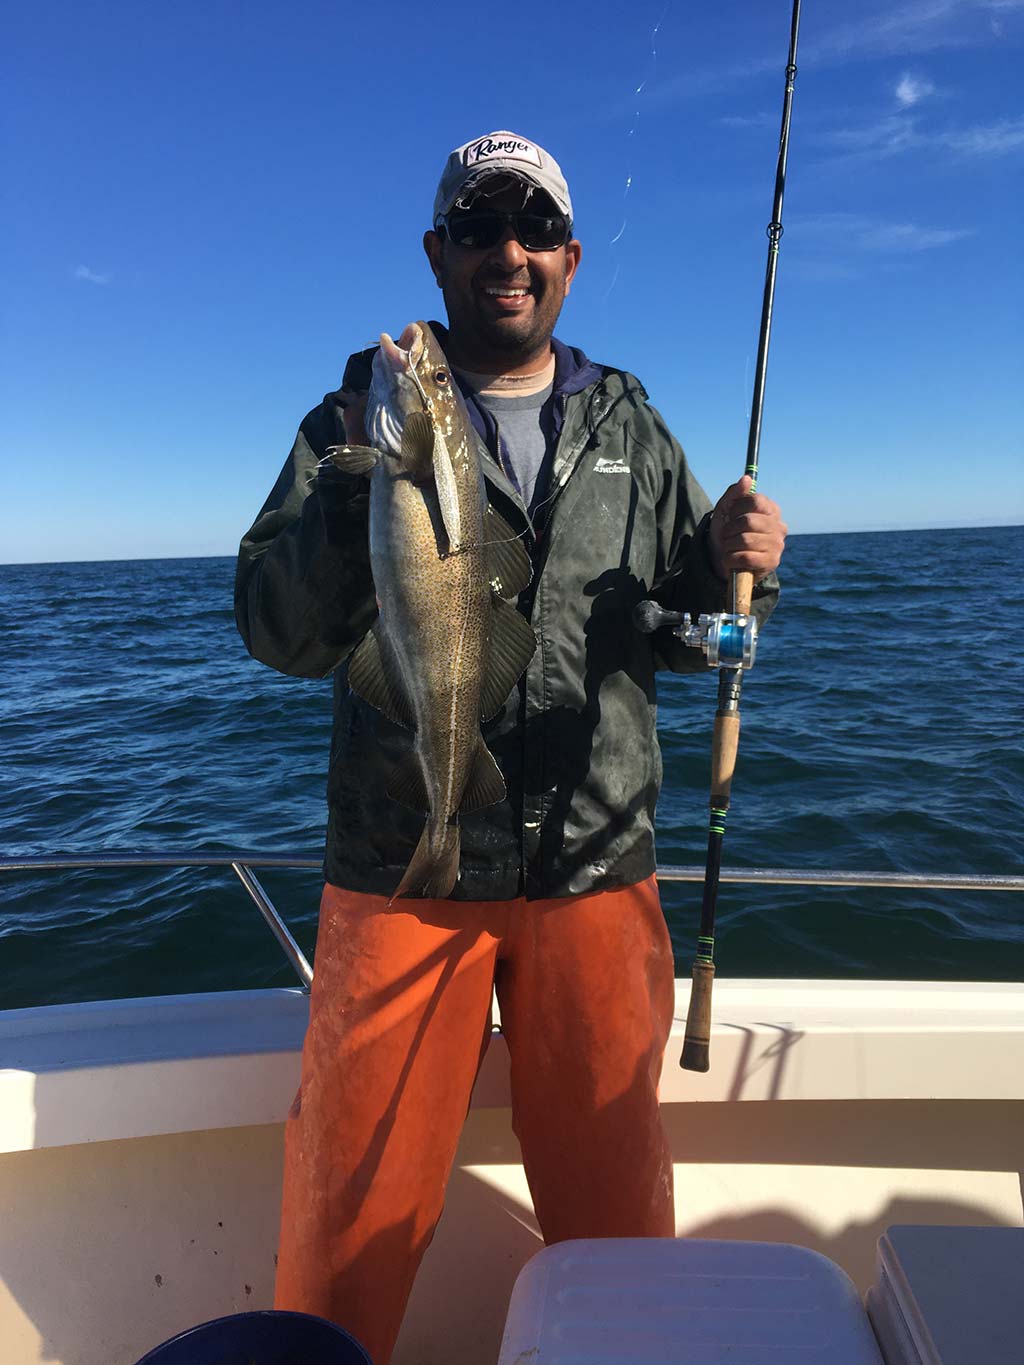
This tool has made the reconnaissance process ahead of a trip for structure-oriented species such as sea bass, cod, fluke, and porgies a lot more interesting and efficient. I also find that the visual depiction of structure makes orienting and positioning the boat much more intuitive when I can easily visualize the structure and my position relative to it. Reefs I had fished my whole life and developed game plans for, were revealed in startling complexity, changing the game in places I thought I knew like the back of my hand.
Wrecks & Reefs
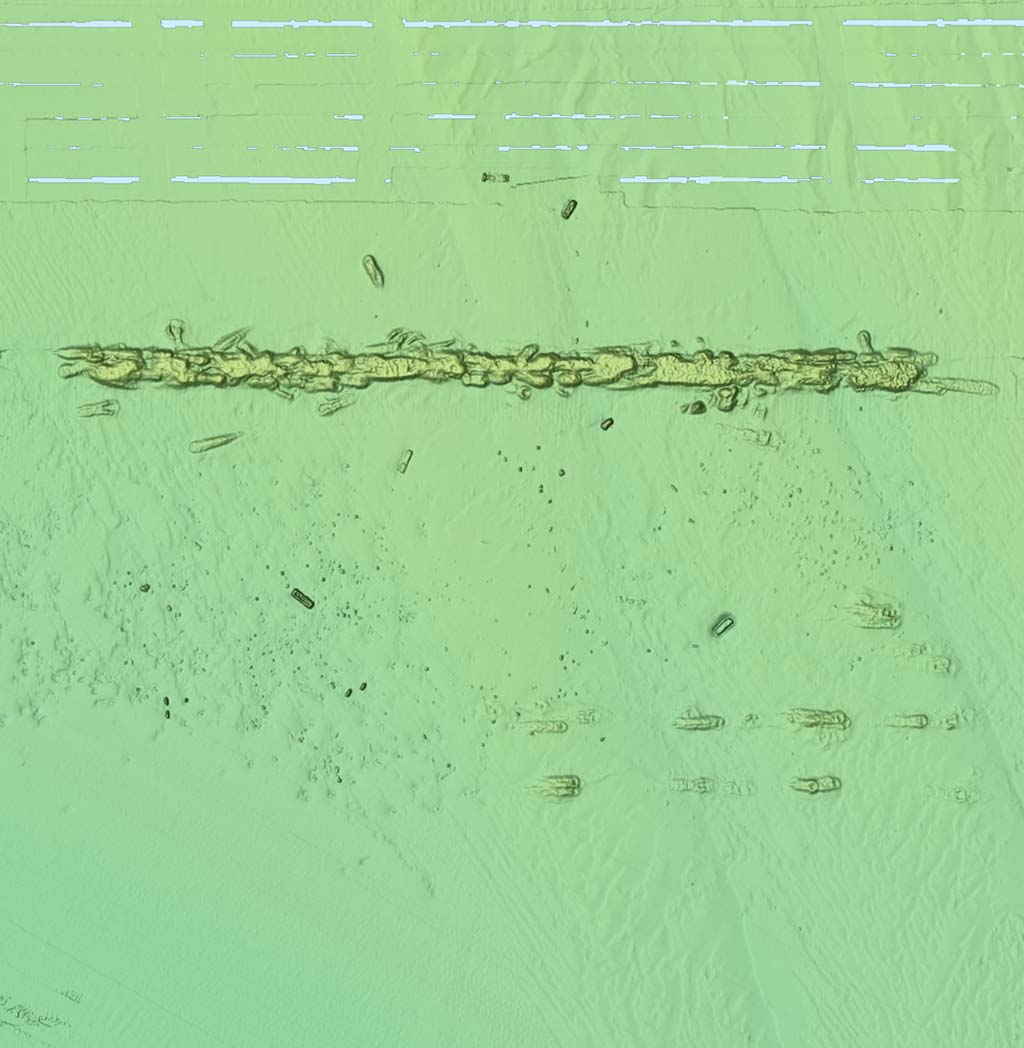
The BAG data is particularly useful when targeting shipwrecks and artificial reefs. On traditional charts, shipwrecks are indicated by a simple wreck symbol. This symbol does not really give any indication as to the size or orientation of a wreck, and for smaller wrecks can make it challenging to position the boat accurately. The BAG data clearly indicates the size, and position of each wreck. Artificial reefs often appear on charts as solid polygons, but when in reality the structure is placed in discrete clusters to form what is known as a “patch reef.” Where there is coverage, the BAG data shows artificial reefs in stunning detail, and greatly facilitates setting up on the structure.
Home Recon
The BAG data can be accessed and used by anglers in a variety of ways and at different price points. The BAG data can be viewed free through multiple online mapping platforms. The NOAA Bathymetric Data Viewer (https://www.ngdc.noaa.gov/maps/bathymetry/) allows users to view the BAG data, as well as numerous other mapping datasets, and allows users to identify the GPS coordinates of features on the map by hovering the mouse above the point of interest. To view the BAG data, on the left hand side of the page make sure that only the BAG Color Shaded Relief layer is selected. From there users can zoom to the area of interest. In the event that the footprint of the BAG data does not cover a certain area, there is a good chance that the Digital Elevation Model (DEM) layer will have coverage. The DEM dataset has a larger area of coverage than the BAG, also depicts the elevation of the seafloor as a surface, and can provide some insight into the type of structure, but lacks the tremendous detail of the BAG. Both of these “layers” can be viewed simultaneously at the NOAA Bathymetric Data Viewer Page, for a more seamless coverage experience.
The BAG data can also be viewed and interacted with NOAA online mapping platforms supported by ESRI, a software company that produces Geographic Information Systems (GIS) software used by geospatial and resource scientists to create maps and analyze spatial data. This online platform is free to access at (https://noaa.maps.arcgis.com/home/index.html ). From there, click the Oceans Coasts icon, and on the next page you can select the BAG viewer. This platform offers some additional features to interact with the data. This site also features a measuring tool, which is useful for determining the size or distance between pieces of structure. It also has the option to export an area of interest as a pdf or image file, which is useful for sharing with friends, printing out and marking up with notes, or if you happen to be writing an article for The Fisherman Magazine.
In The Field
The online mappers are great for doing research and checking out the data on a full size computer screen. However, they are not super convenient to use out on the water and would require connection to a cell or Wi-Fi signal. There are multiple options to use the BAG while out on the water.
The first is through the Navionics Boating smartphone app. Over the last few years, the Navionics app has become a favorite tool to find and navigate to fishing spots. It allows users to
easily view traditional government navigational charts, more detailed contour lines, and more recently, a seamless combination of what appears to be the BAG and DEM data sets. The BAG data shows up under the relief shading option. One of the great things about this app is it allows users to overlay traditional navigation charts on top of the highly detailed BAG data, which adds another layer of helpful information such as reef names, channel markers, and depth soundings. Perhaps the most useful part of the Navionics app is that it makes use of the internal GPS in smartphones to show your position on the map, so you can mark waypoints and tracks. If in range of cell data service, the relief shading data will show up but may take a bit of time to load. The app allows users to download the base map data ahead of time, so it is available regardless of cell service. At only $15 for the app, it is one of the most useful bargains available to anglers.
It is also possible to load the high-resolution BAG data directly into your boats chart plotter. Companies such as Strike Lines and CMOR charts have made it possible to load the BAG and DEM data right into the chart plotter via a memory card. In some areas, these companies have supplemented the public NOAA data with their own surveys or visualization schemes. If interested in using the data on your chart plotter this could be the easiest way to go.
There is an old fishing cliché that 90 percent of the fish are in 10 percent of the water. The advancement of fish finders, chart plotters, and chart detail have made the process of weeding out 90 percent of the water more efficient than ever. Regardless of how you access it, the BAG data is a great resource for anglers looking to find fish or learn more about their favorite spots.