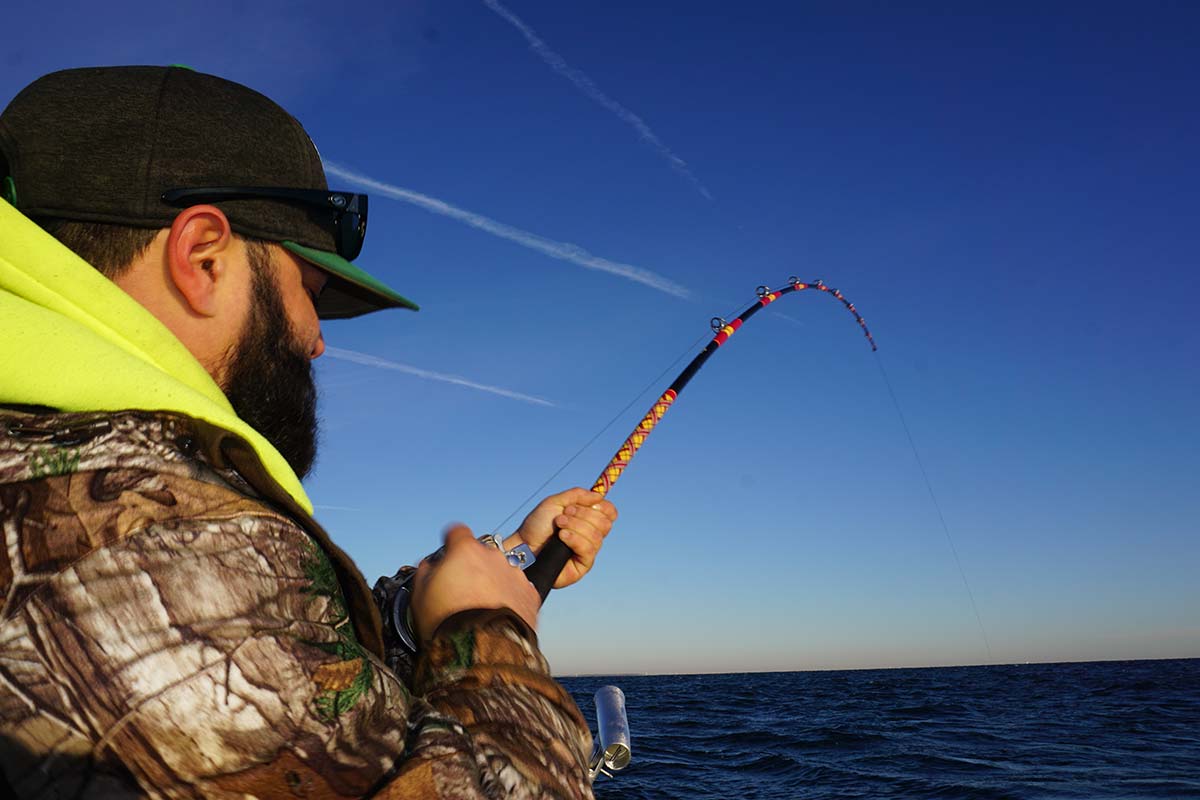
By the time you read this, more than a few 50s have already been released at the Rocks!
Recreational fisherman along Jersey’s North Coast have a dilemma – where to fish? The issue isn’t that there aren’t hotspots, rather, so many to choose from!
In additional to vast natural formations, numerous wrecks from early shipping disasters through vessels sunk by U-boats during both world wars to modern marine casualties adorn the bottom. To this the state artificial reef program added thousands of “patch” reefs – obsolete vessels, tanks, subway cars, dredged rock, concrete castings, bridge demolition materials, other materials of opportunity, and reef balls. Some great manmade reefs are inshore, just a few miles run from sheltered waters. They include the (new) Manasquan Inlet, Axel Carlson, and Sea Girt Reefs. Some, notably Sandy Hook, Axel Carlson, and Shark River Reefs, have massive dredged rock deposits.
North Jersey coastal reef types and numbers are a choice challenge indeed, something like a large fishing tackle emporium where the types and quantity of tackle options confound selection. While trying to figure out from all the tackle options what will entice a bite, we can easily forget that sometimes all a fish might want is a worm! Thinking fishing reef, maybe all some fish want is a ledge! If that’s what they want, the northern region doesn’t disappoint.
Prime Locations
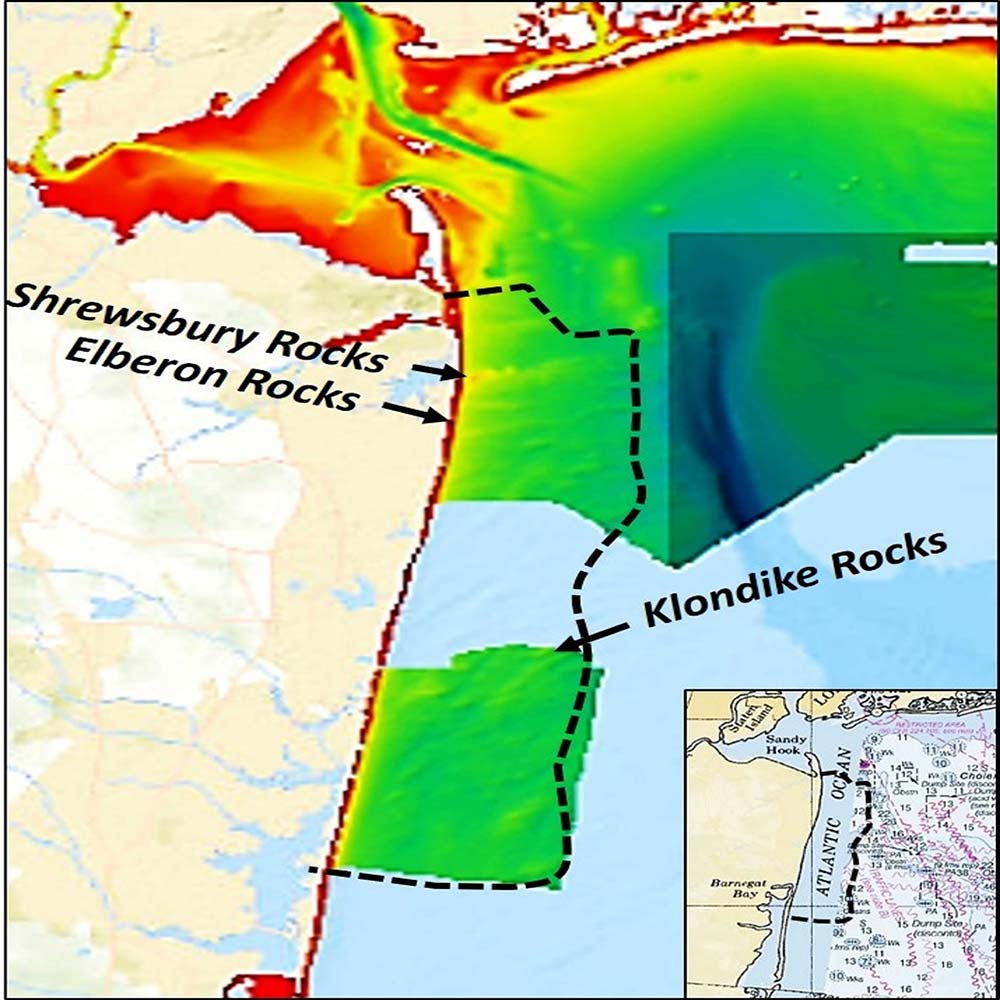
Natural rock formations north of Barnegat Bay, outlined by the dashed black lines shown on Chart 1, are legendary. They’ve been fish (and fisherman) magnets since colonial times. The formations are a type of sandstone called greensand. Much has been written about how to fish them. Bathymetric charts and shaded bathymetry charts aid in identifying high spots, low spots, and drop-offs. Sonar charts with 1-foot graduations show steep edges as a dark mass of lines. Even so, a more complete understanding of bottom configuration can aid in identifying structural features with a high potential to attract and hold bait and sportfish.

There is an easily accessible on-line resource that provides an area-wide birds-eye picture of the bottom that enables us to do just that for the north coast formations. That resource – the National Oceanic and Atmospheric Administration’s (NOAA) Bathymetric Data Viewer, or BDV. Add to that recreational diver reports and underwater pictures, and we’re on our way to discovering reef details that are not obvious from other sources.
There is far too much structure to cover all of the interesting nooks and crannies. So, the objective here is to share an overview of the extent of natural formations and examples of what can be learned about them using BDV “BAG” (Bathymetric Attributed Grid) shaded color relief images. The computer screenshot illustrations presented are processed to highlight bottom features, but are representative of BDV BAG image content. The BAG image is a side-scan-like multibeam sonar picture of the bottom. For guidance about how to use the BDV see Discovering Atlantus: Using The Bathymetric Data Viewer, from the March, 2020 edition of The Fisherman (New Jersey, Delaware Bay edition).
The BDV “BAG” image coverage shown as the colored bathymetry in Chart 1 covers a substantial portion of the north coast formations. We can “see” a bottom picture of the Shrewsbury Rocks (including The Rattlesnake), Elberon Rocks, and most of the Klondike Rocks. The current BDV image predates establishment of the Manasquan Inlet Reef in 2017. So, for that reef, only a pre-reef bottom picture is available. Where BDV coverage ends, the BDV “DEM” color shaded relief feature which is based on a soundings model can fill in gaps. The DEM relief shows a less precise rendition of where there are ridges, mounds, holes, and high and low spots.
Nautical charts are an essential basic frame of reference. However, government nautical charts are designed to support marine surface navigation. They generally inform fishing, but are not fishing charts with data keyed to fishermen. Charted contour lines mark a change in depth at preset intervals. Where the graduation is in multiple feet, the visual effect is a smoothing of the bathymetry. Contour line orientation relative to bathymetry can also convey a somewhat ambiguous or misleading perception of the actual orientation, extent, and character of bottom features.
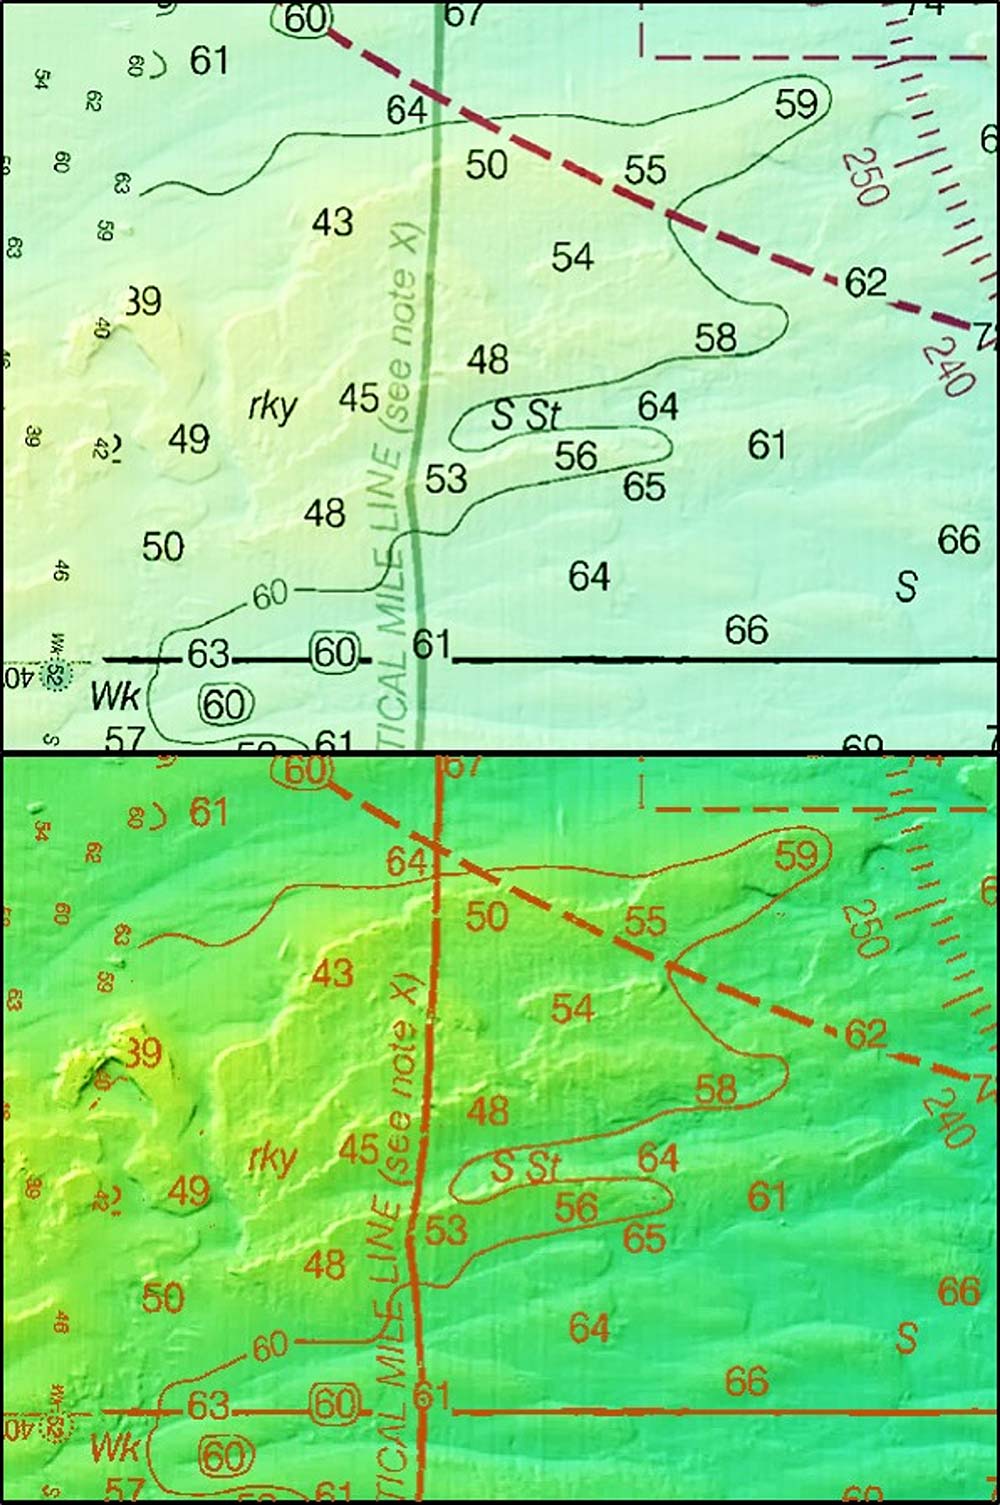
See, for example, Chart 2 which shows The Rattlesnake located at the extreme eastern end of the Shrewsbury Rocks formation. The snake-line contour lines show what appears to be the edge of an east-west ridge. In fact, the contour line actually shows half of the ridge, and completely misses a series of rugged stepped shelves immediately to the north. There is substantially more structure there to fish than suggested by the chart detail. A sonar chart with tighter gradients shows the edges much better, but the rugged character of the edges and outcroppings is still smoothed over.
Ledges, Edges & Mounds
Primary north coast rock formations, including one just north of Elberon Rocks, contain various combinations of ledges, edges, shelves, mounds, fissures, outcroppings, and substantial scattered boulders. The formations generally run from or near the shoreline towards the east northeast. On the north end of the formations, there are low outcroppings charted as obstructions immediately west of Sandy Hook Reef. Moving from there to the south, the next formation is Shrewsbury Rocks. This is by far the most extensive of the sandstone formations. Vertical relief at some spots is as much as 20 feet. Formations further south have less vertical relief, with 10 feet of vertical relief at the top end. Generally, the further south, the lesser the vertical relief.
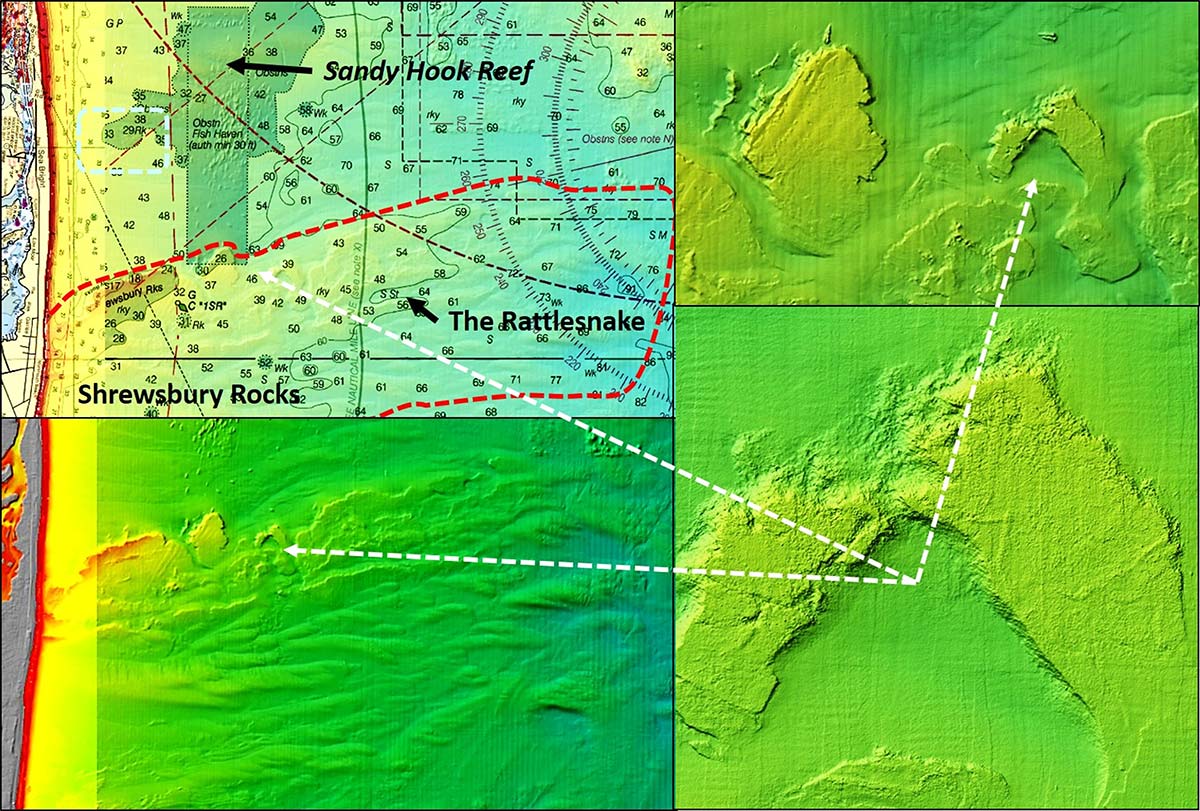
A bottom picture of Shrewsbury Rocks and zooms of its northernmost outcropping are shown in Chart 3. Similar pictures can be generated by the BDV for Elberon Rocks, Manesquan Ridge and The Klondike, and also the Axel Carlson, Sea Girt, Sandy Hook Reefs. The closeup zooms for the Shrewsbury Rocks outcropping across the Sandy Hook Reef south boundary convey a very rugged character as well as pathways through the formation and flats where there may be sediment deposits. This is consistent with diver reports and images, such as found on njscuba.net. Distinctive features like this are prime spots to check when prospecting using recreational side-scan and down-looking sonar scans.
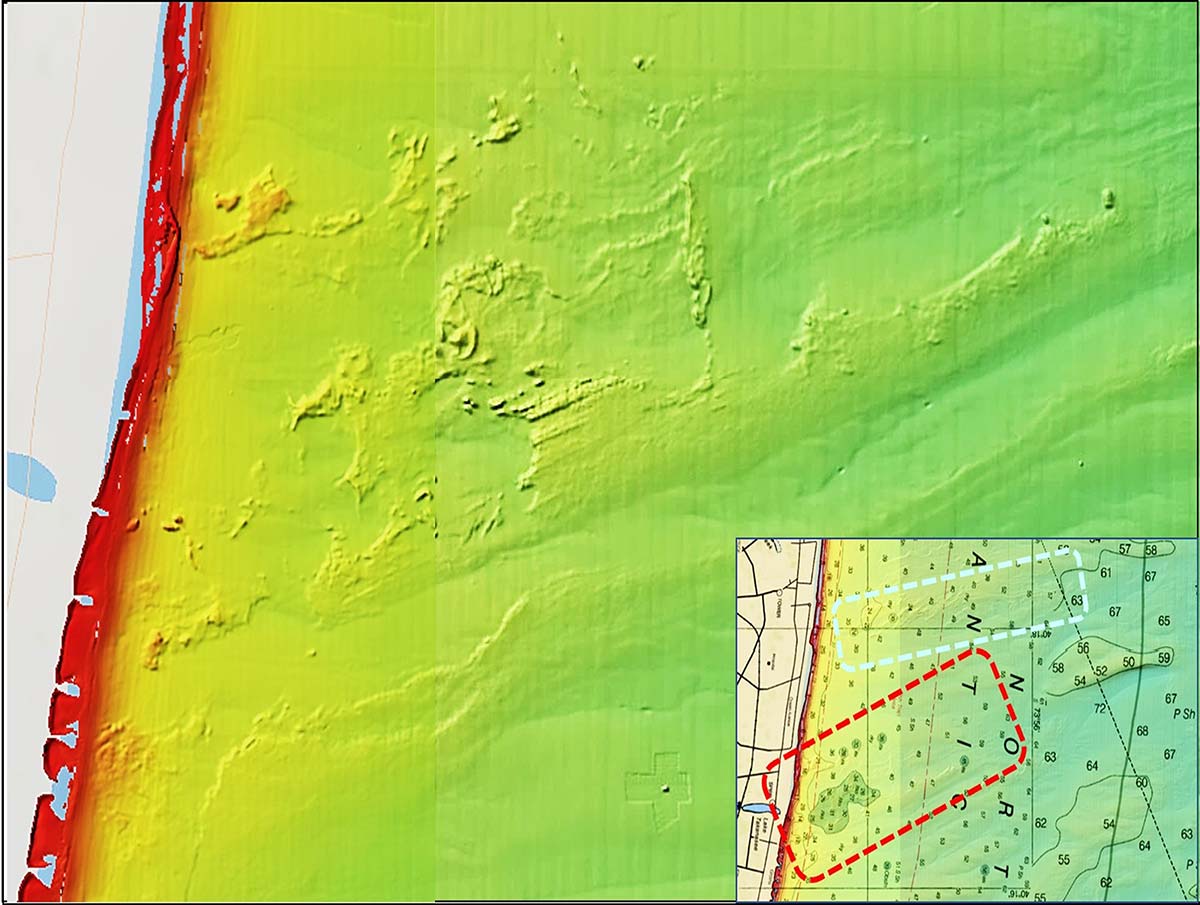
Chart 4 is a BDV bottom picture of Elberon Rocks, also shown inside the red dashed line in the bottom right insert. The dashed light blue line in the insert is another hard formation immediately to the north. Fire up the BDV on your computer and zoom in on the BAG color shaded relief image to see high definition detail for these formations. The clarity for these reefs is sufficient to see small round and oblong objects that are consistent with boulders reported by recreational divers. The features shown in Charts 3 and 4 provide both cover for bait and spots for predators to wait in ambush. Swirling hydrodynamic conditions would be expected where currents interact with the highly irregular edge configurations.
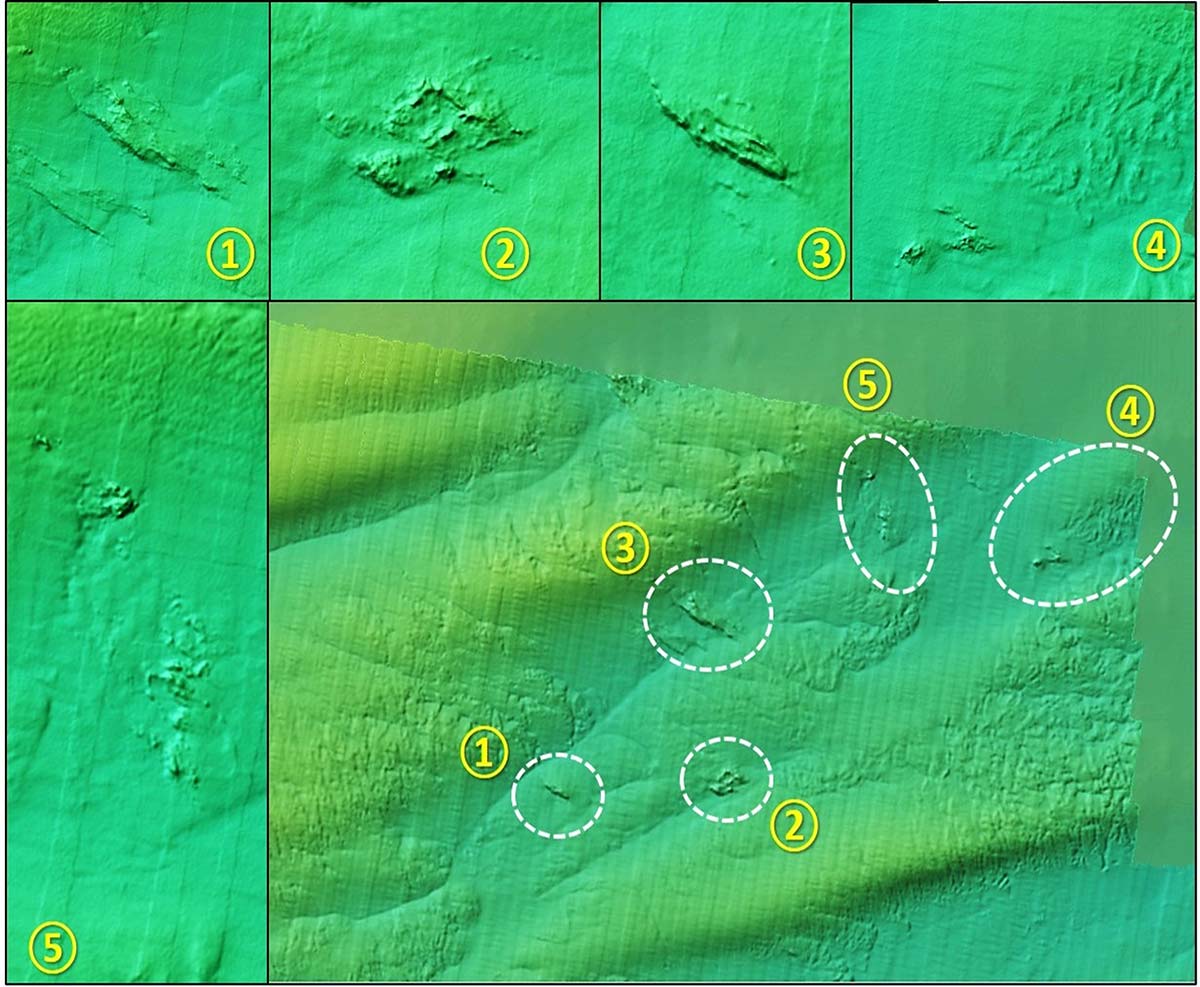 The Klondike Rocks are east of Sea Girt Reef. There are large elongated mounds. A close in zoom shows ruggedness on side slopes that is consistent with fissures reported by divers. Rock outcroppings are also visible. The more prominent rocks are shown inside white dashed lines (Please note that the BDV coordinate box in the lower left-hand side of the computer screen gives a coarse reading). In my experience, there is up to about a 20-foot error depending on the zoom level. So, when using BDV generated coordinates, anticipate that some on-site searching with a fishfinder or sonar will be needed to locate them. –W. Young
My approach for armchair scouting reef formations like those presented is to look for sharp edges, side slopes, channels or pathways through formations, canyons or ravines, outcroppings, and flats. I’ll also check for local diver reports as they can be very revealing about type, configuration, and condition of structure. This advance research informs my prospecting for sweet spots with my fishfinder and side-scan and down-looking sonars.
The formations discussed are extensive. Where fish were yesterday may not be where they are today, but hotspots sometimes remain hot for a while. So, be sure to check reliable fishing reports to learn where fishing has been productive. Compare this with the BDV reveals, assess existing environmental conditions, put together a fishing strategy for the day, and enjoy what nature has provided for us.
Wayne Young is a former manager of the Maryland artificial reef program for Chesapeake Bay waters. He is the author of “Chesapeake Bay Fishing Reefs: Voyages of Rediscovery” available on Amazon.com. His Facebook page is Chesapeake Bay Fishing Reefs. Charts and bathymetry images are processed screenshots from the National Oceanic and Atmospheric Administration’s Bathymetric Data Viewer which can be found at https://maps.ngdc.noaa.gov/viewers/bathymetry.