Long before the Danish windfarms, German U-boats already made their marks off A.C.
Coming to an ocean near you over the next decade or two are huge offshore wind farms. Huge windmill towers will be installed on or in proximity to prime clam and scallop fishing grounds about 15 miles off Atlantic City.
Late in 2019, New Jersey awarded development of “Ocean Wind Farm” to a Dutch Company with the largest power generating turbines in the world planned for installation. Foundation design for offshore windmill structures depends on depth. Depths associated with the leased bottom area east of the Atlantic City Reef are in the range that enable use of monotubes driven deep into the seabed or jacketed gravity foundations rather than lattice work structures.
There are many questions about wind farm effects on fisheries during construction and operation; so, the Mid-Atlantic and New England Fishery Management Councils have established a webpage designed to keep recreational and commercial fisherman updated about the status of wind farm development, which will include installation of undersea cables to bring power ashore. Burying the cables to a depth that minimizes conflict with commercial ocean clam and scallop dredging is among the design issues.
Protecting the bases from scour is another issue, and may result in lots of rock around the bases as was done for test windmill sites off Virginia. One thing is for sure, new offshore structure will result in new artificial habitat in the water column and potentially recreational fishing opportunities, so long as there are no restrictions on angler access or impacts on the marine ecosystem.
Go Wreck Hunting
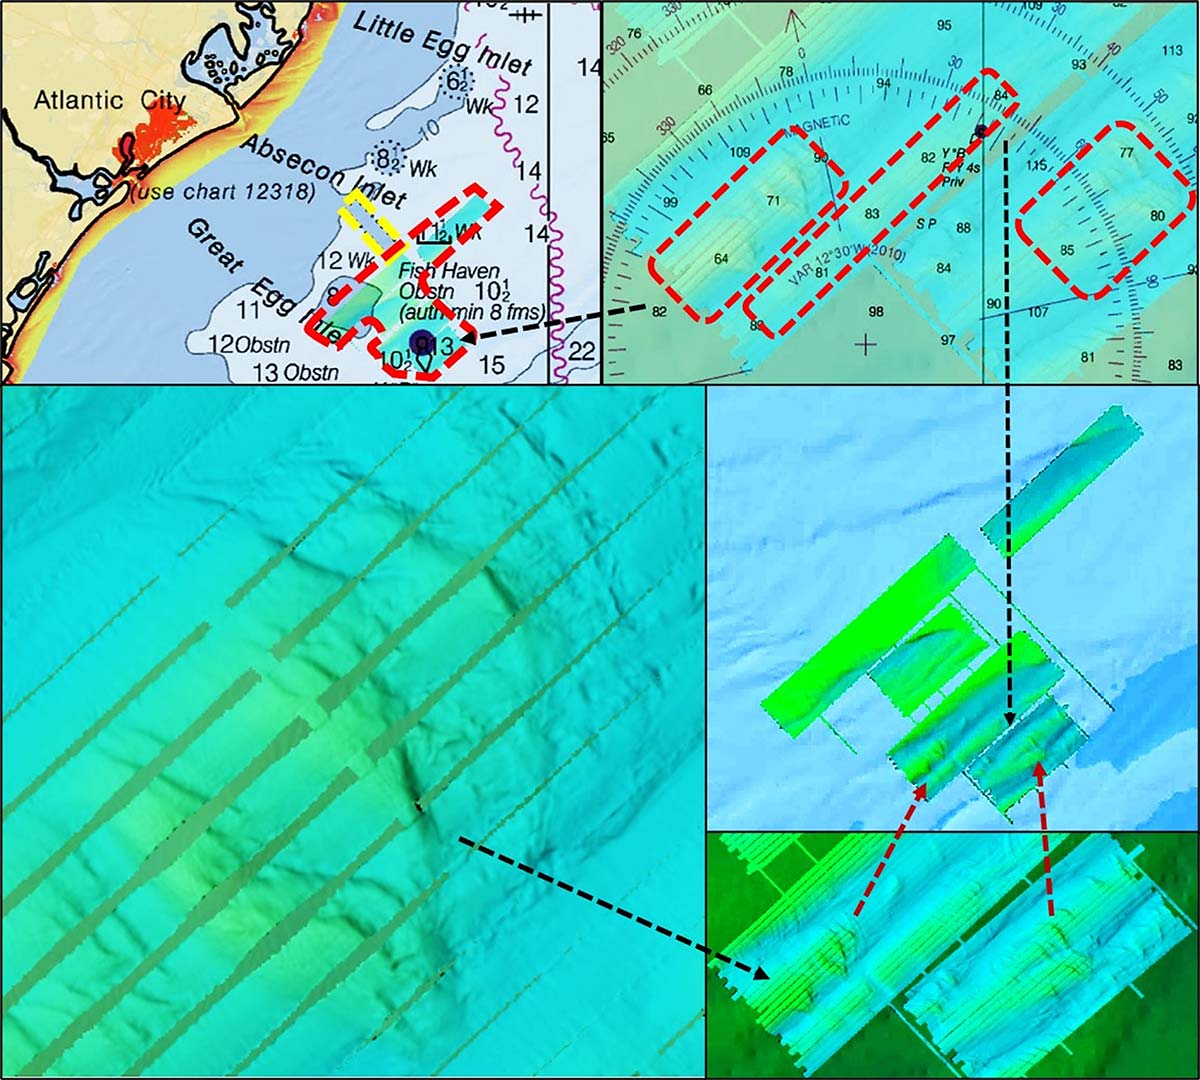
Environmental assessments for ocean wind farms include bottom surveys of benthic conditions. Survey results included the Bathymetric Attributed Grid (BAG) Color Shaded Relief imaging for large bottom areas east of the Atlantic City Reef. These side-scan sonar-like images in the multi-color rectangular areas inside the red outline shown in the top left insert on Chart 1 are accessible using the National Oceanographic and Atmospheric Administration’s (NOAA) Bathymetric Data Viewer (BDV) which can be found online at www.ncei.noaa.gov/maps/bathymetry.
The bathymetry easterly of the Atlantic City Reef consists of a series of broad ridges and troughs oriented approximately southwest to northeast. Some of the ridges feature rugged bottom, as shown by the right and bottom inserts on Chart 1. The ridges rise as much as 20 to 40 feet above the depths shown in the troughs. The area appears void of charted wrecks; however, upon closer examination you’ll find a lot of rugged bottom features to check out for flatfish.
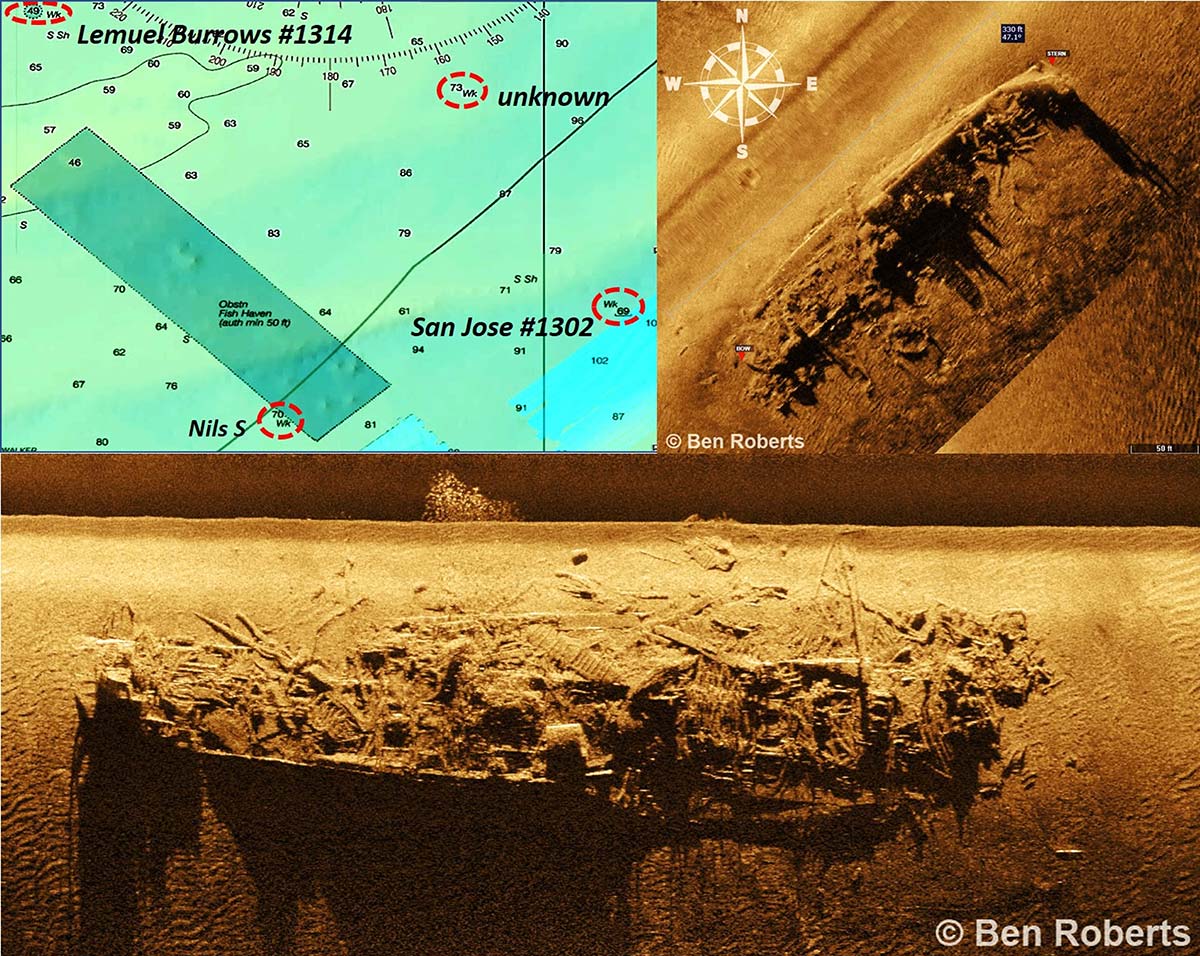
The wreck of the freighter San Jose shown in Chart 2 is just outside of BAG imaging coverage. It is documented as Record #1302 in the Coast Survey’s Automated Wreck and Obstruction Information System (AWOIS). The vessel sank as the result of marine casualty in early 1942. The record states that it rises 31 feet in 105 feet of water. A detailed history of the marine casualty is presented in Gary Gentile’s Popular Dive Guide Series, Shipwrecks of New Jersey: South (2002).
The vessel was a passenger freighter with a length of 330 feet and breadth of 44 feet. At the time, U-Boats had only recently begun a relentless attack on coastal shipping, and the vessel was running dark on a dark night in fog during this pre-radar era when it collided with another ship. San Jose was too badly damaged and sank. The other ship survived, but not too long after was sunk by a U-Boat, as described by Gentile. He also reported that the Captain of U-123 claimed to have sunk the San Jose. While this possibly occurred after the ship was abandoned by her crew, the U-Boat skipper (who survived the war along with U-123) was known to have padded his sinking reports!
New ‘21 Imagery
The San Jose wreck was demolished and wire dragged in 1950. The vertical rise off the bottom was reduced to 10 feet, primarily where there was machinery. The hull was partially intact and rested to some extent on its starboard side. Additional information is available at njscuba.net, including pictures of the ship.
This wreck was investigated by Ben Roberts, Eastern Search & Survey (ESS), in early 2021, who shared sonar scans with The Fisherman for this article. There were fish over the wreck when he imaged the site. As can be seen in the scan, the wreckage, although torn up, densely covers the bottom. This is definitely structure to put on the offshore check out list!
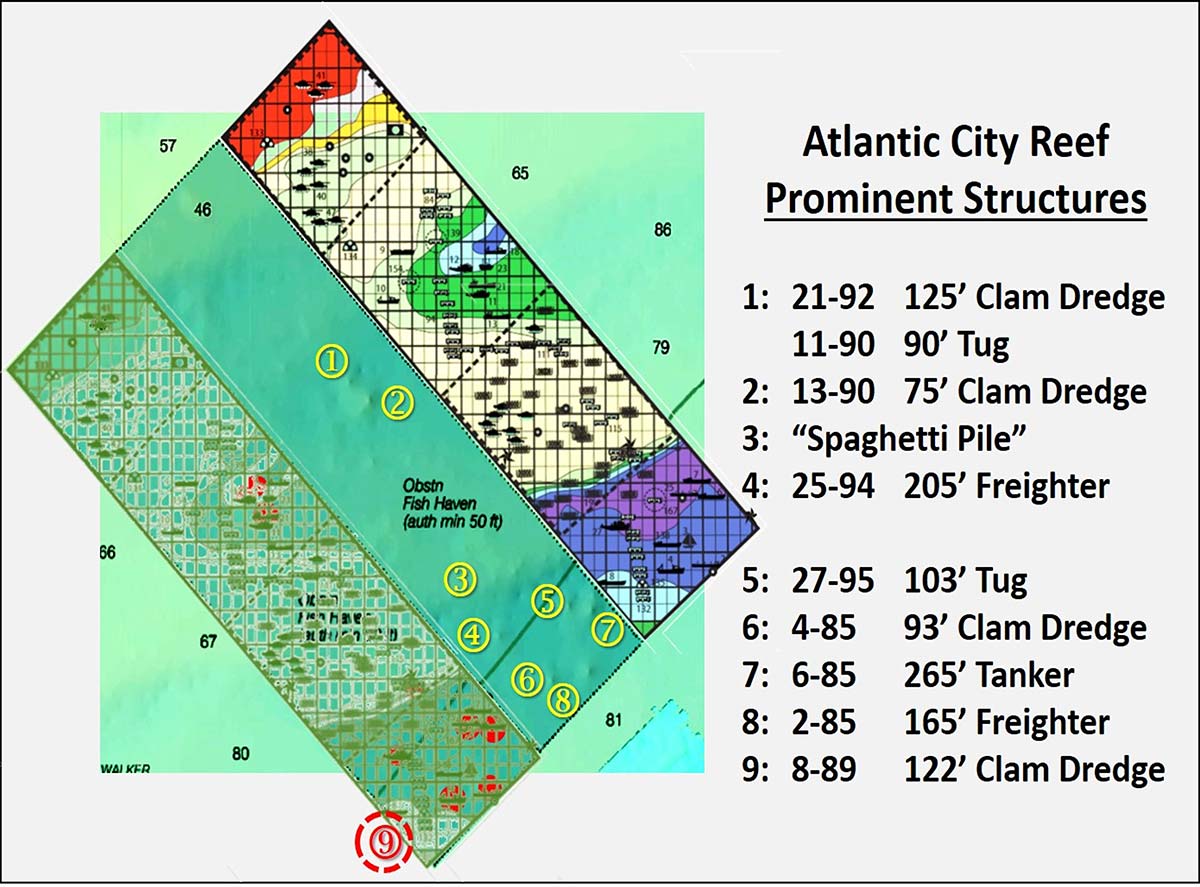
According to njscuba.net, artificial reef development of the Atlantic City Reef dates from about 1935. However, the first recorded reef was deployed in 1985. The reef site is outside of BAG Color Shaded Relief coverage. Digital Elevation Models (DEM) Color Shaded Relief imaging of sounding data shows a number of dimples on the bottom, especially in the southeastern third of the reef site. These are shown in Chart 3, a side-by-side comparison of the DEM image, the New Jersey reef system grid, and a version of the grid converted to a line drawing for overlay purposes.
There are at least 17 sunken vessels in the reef site along with other materials such as Army tanks and piles of steel cable. The latter, reef object #3 in Chart 3, are referred to as the “Spaghetti Pile” by njscuba.net. The website also reports that the piles slowly settle into the bottom but are also tautog hotspots. Click on the website map for Atlantic City Reef; then click on the icons to access pictures and descriptions for each of the sunken vessels at the reef site. Many of the artificial reefs that were deployed at the Atlantic City Reef were entered as “fishing facilities” in the Navionics Community Layer. If you use Navionics in your electronic navigation chart or have the application on your smart phone, click on the icon (fish inside a circle) for approximate coordinates.
Structure Spread
There is also a charted wreck just northwest of the southeastern corner of the reef site. This is probably the Nils S, a 122-foot clam dredge recorded on the reef grid and, as shown on Charts 2 and 3, appears to straddle the reef site boundary.
Off to the northwest is the wreck of the Lemuel Burrows, AWOIS #1314, also labeled in Chart 2. Known locally as the “Collier”, Lemuel Burrows was torpedoed by a German U-Boat in 1942. The hull was wire swept to clear it as a hazard to navigation in the coastal shipping lanes. Vessel remains are a distributed mass on the bottom with substantial high spots associated with deck gear sand machinery. This wreck was also investigated by ESS during the 2021 offshore wreck investigation project. Side-scan sonar images of this site are posted on the ESS free Google map. Search for Eastern Search & Survey map on your browser to link to the map webpage.
While the future of bottom fishing east of Atlantic City is up in the air, there is plenty of artificial structure in the area as it stands now that’s worth checking out. If the weather is nice and the reef site wrecks aren’t producing, those rugged bottom areas being investigated for the wind farm may be worth a look.
Wayne Young is a former manager of the Maryland artificial reef program for Chesapeake Bay waters. He is the author of “Chesapeake Bay Fishing Reefs: Voyages of Rediscovery” available on Amazon.com. His Facebook page is Chesapeake Bay Fishing Reefs. Charts and bathymetry images are processed screenshots from the National Oceanic and Atmospheric Administration’s Bathymetric Data Viewer which can be found at www.ncei.noaa.gov/maps/bathymetry or simply by Googling “NOAA Bathymetric Data Viewer.”