Photo by Jim Hutchinson, Jr.
Reviewing BDV info in advance of a new 2020 fishing season!
Bottom structure in coastal waters may be prominent enough to have charted names such as Shrewsbury Rocks, or designated as shoals, wrecks, or obstructions. Some may be marked by aids to navigation, or inferred from sounding data and depth contour lines on nautical charts. But there are also rugged and high relief bottom features where nautical chart detail suggests only flat or gradually sloping bottom, or obscures the size and character of substantial wrecks and obstructions.
An online resource (maps.ngdc.noaa.gov/viewers/bathymetry) called the Bathymetric Data Viewer, or BDV, can help us find this uncharted or “under-charted” bottom structure. For example, a BDV side-scan sonar image helped shed light on the identity of a wreck off Townsends Inlet that reemerged from the sand over 125 years after it disappeared (Ghost of Nuphar; February, 2020 edition of The Fisherman). The BDV, a National Oceanic and Atmospheric Administration (NOAA) application, is something that serious light-tackle fishermen should know about. And, it’s free!
Reviewing the Images
NOAA BDV side-scan sonar coverage is partial and mostly inshore. Exceptions include the New York Bight, Lower New York Harbor, and entrance to the Delaware Bay. The search for prominent bottom features is aided by BDV shaded sounding images where side-scan coverage isn’t provided. Despite coverage limitations, the BDV is nevertheless worth checking out. Commercial products that show bathymetry and relief can also be used to obtain more detail than does a standard nautical chart. For example, where there are steep shoals or edges with sharp drop-offs, tight gradients produce dense bathymetry contours that indicate bottom formations with fishing potential. Also check out recreational diver websites such as www.njscuba.net for detail about specific reefs. When used together, this information can greatly improve our understanding of bottom conditions and where to fish.
Where BDV side-scan sonar coverage is available, structure is revealed by using image overlay features. The combination of color sonar data and side-scan sonar images shown in shaded relief overlaid by a translucent nautical chart provides a powerful search aid. Look for anomalies under the see-through chart. In some spots, charted features that appear smooth may bleed through showing that they are far more rugged than apparent from the configuration of depth contour lines. Other anomalies are subtle, blending into chart colors, essentially hidden in plain sight. They can be easily missed without careful, close review.
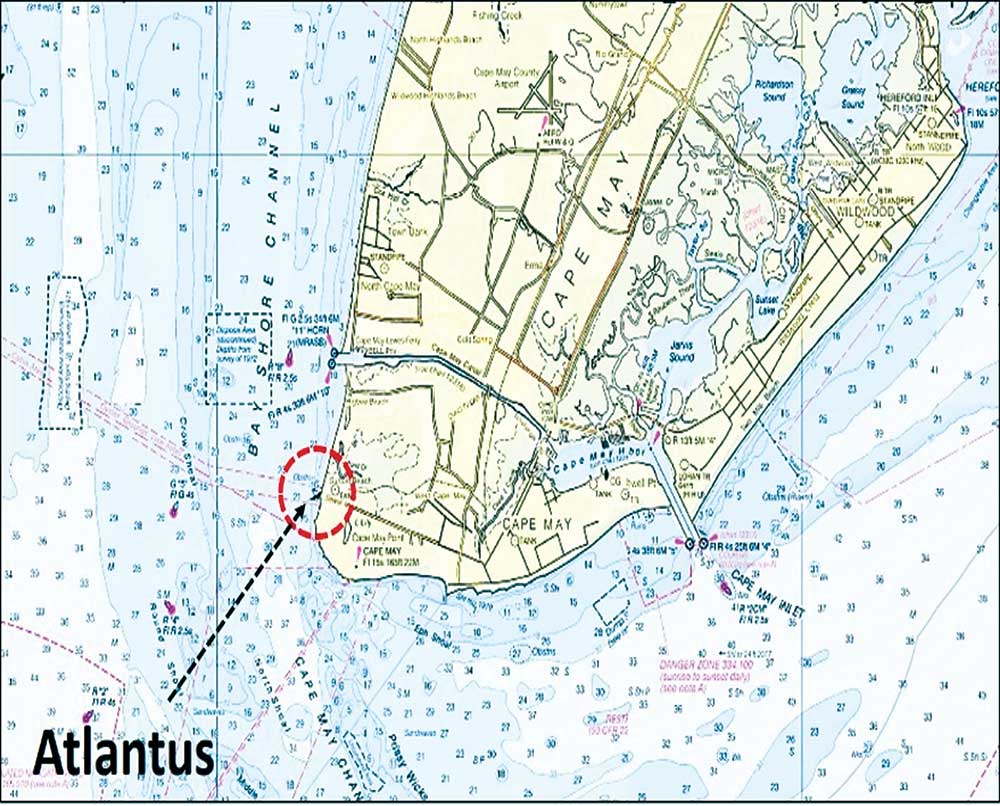
An example of what to look for using BDV capabilities is found on the west side of Cape May Point. Look for abandoned, broken, and displaced pipelines (locations “A” and “B” in CHART 1) from an old magnesite plant, now part of the Higbee Beach Wildlife Management Area at Sunset Beach. Immediately south at location “C” on the chart lies the remains of the SS Atlantus, a World War One concrete Liberty ship. She was one of 12 that were constructed.
The Atlantus actually made a few transatlantic transits for the military just after the war ended, and was then turned to commercial service but was not economical. She was purchased and towed near her present location where the ship was to serve as a breakwater for a cross-Bay ferry. However, she broke free in a storm and grounded where she now lies. Refloating the vessel failed, and she was abandoned in place. Today, after nine decades of pounding, she lies in pieces, mostly below the surface, a fractured relic of what was visible to us back in the 1950s. Life was slower back then, and driving down to Cape May Point from Sea Isle City to look at the concrete ship was an annual family day trip tradition.
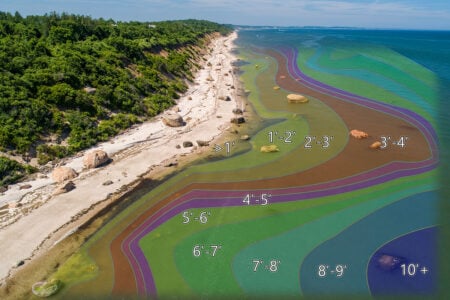
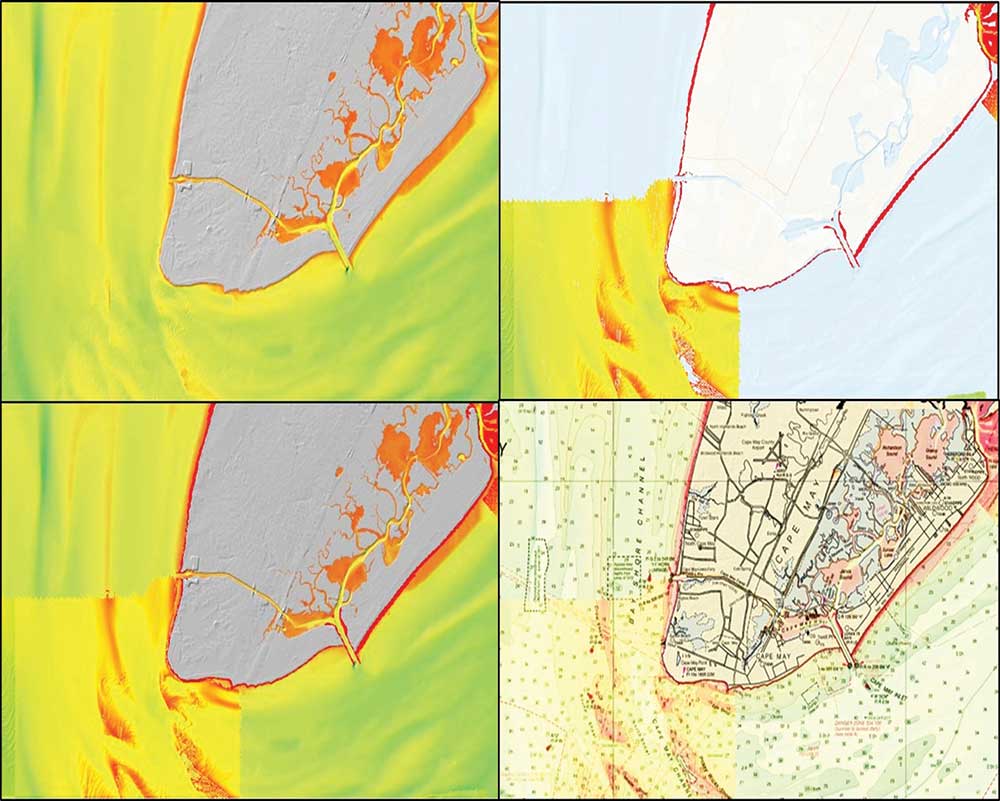
The four-image graphic (CHART 2) shows the different visual scenes that the BDV can generate. “DEM Color Shaded Relief” displays sounding data, shown in the top left portion of CHART 2. “BAG Color Shaded Relief” displays side-scan sonar images, shown in the top right. DEM and BAG images can be combined (bottom left), and either or both can be overlaid by a raster nautical chart (lower right). This is the basic toolbox for using the BDV to search for bottom structure. Graphic colors were heavily processed to highlight features that are embedded in the images. To get the results shown in the three-image illustration, take a screenshot and paste as a graphic file into a presentation or photo program to adjust brightness, contrast, sharpness, and color intensity. These adjustments clarify the form of shoals, sloughs, and channels.
Using the BDV Site
Use the following protocols to call up the BDV images. First, search for “NOAA Bathymetric Data Viewer” using your browser (maps.ngdc.noaa.gov/viewers/bathymetry). Once into the application, click off the Multibeam Survey and Hydrographic Data boxes to remove reference data. Click on the “BAG Color Shaded Relief” box to get to the side-scan sonar images. Where the side-scan coverage is partial or ends, click on the “DEM Color Shaded Relief” to fill in depth sounding images.
NOAA BDV color-shaded relief for soundings covers virtually the entire water area and is useful for scoping broad areas. Overlay the image with a translucent navigation chart using a click-on box in a drop-down box located at the top right corner of the screen. Zoom in and look for anomalies under the chart layer between depth lines. Also look along steep drop-offs for anomalies. Then, remove the chart layer to see what’s there. Some interesting features stand out because of the colored shading! Where only sounding data are available, the features are smoother than actual conditions because the data are not a precise sonar picture of the bottom.
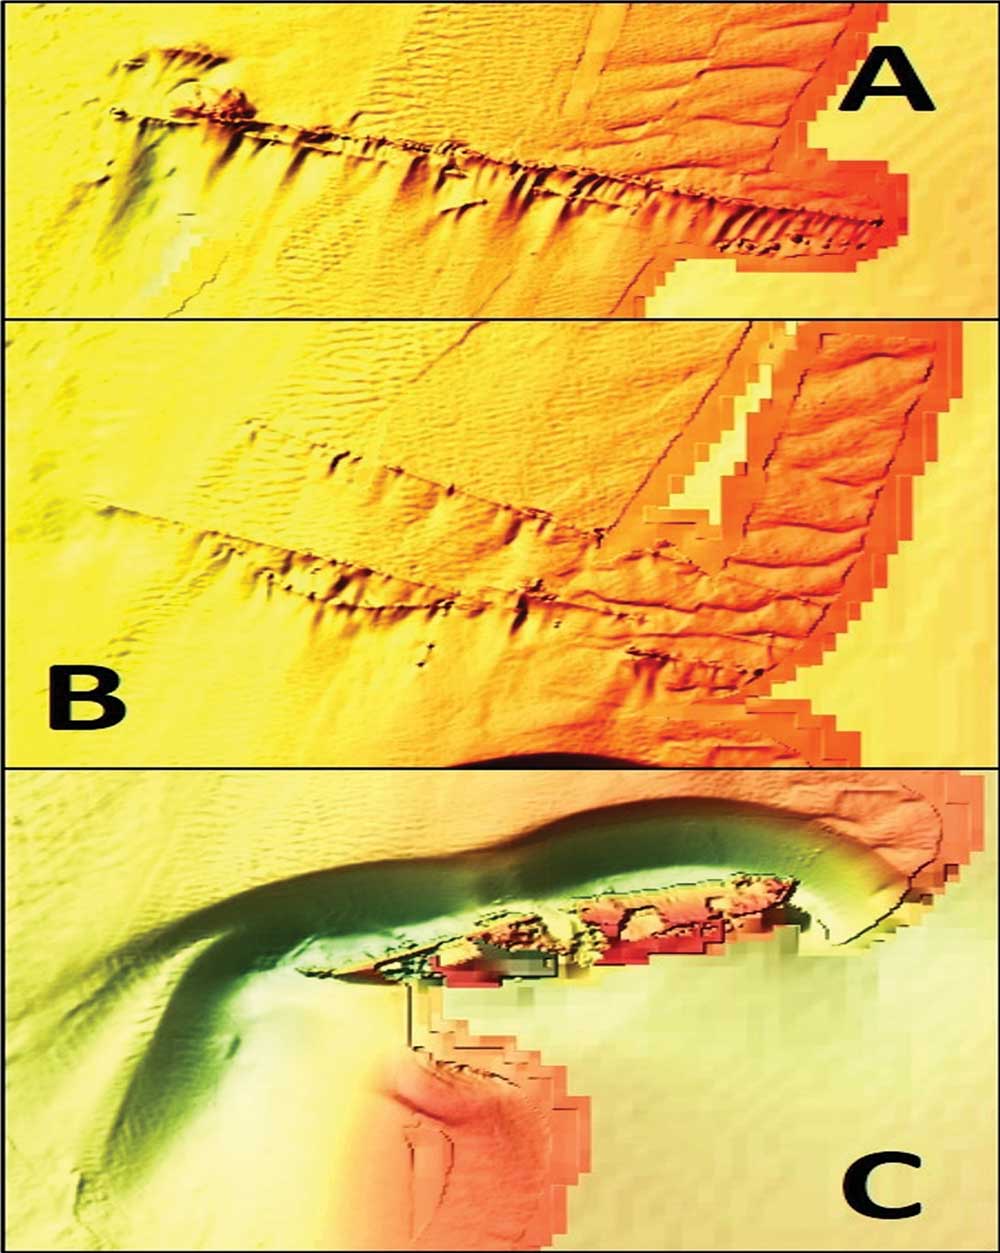
Make sure to zoom in on the various bottom features shown in the side-scan images. Some remarkable features are sometimes revealed! The closer the zoom, the sharper and more detailed is the image. Look for sub-features within structure such as underwater ravines, bowls, ridges, and ledges that fish may orient to. Also check current data, and consider how current may react with the structure in relation to predator foraging patterns. For example, zooming in on the pipelines revealed broken and displaced sections, not surprising considering they were abandoned in place in a high energy area. The zoom in on the Atlantus shows the wreckage lying in a deep scour hole. The orientation of the scour holes shows that the net flow around the wreckage is from the north towards the southeast around the point.
In the past, many hotspots would have escaped our attention unless we ran over top of them while paying attention to the fishfinder or sonar scan, unless they were otherwise disclosed in fishing reports or a guide book. Even then, the sweetspots are held close. The Bathymetric Data Viewer provides a means to scout out and find fish-attracting configurations in bottom structure while in the comfort of home, helping us focus our fishing effort when on the water.
Wayne Young is a former manager of the Maryland artificial reef program for Chesapeake Bay waters. He is the author of “Chesapeake Bay Fishing Reefs: Voyages of Rediscovery” available on Amazon.com. His Facebook page is Chesapeake Bay Fishing Reefs.