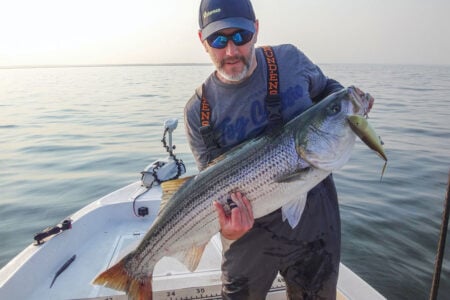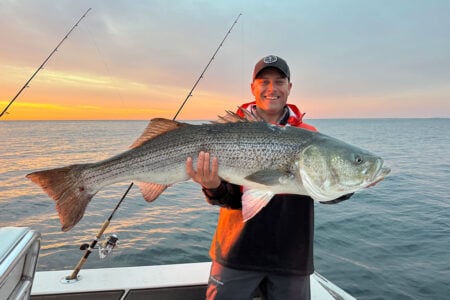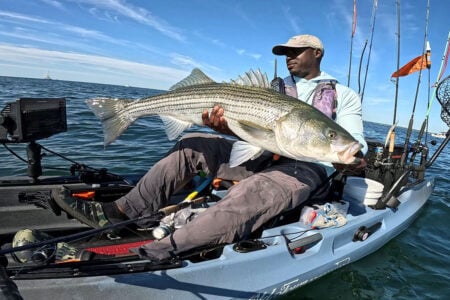
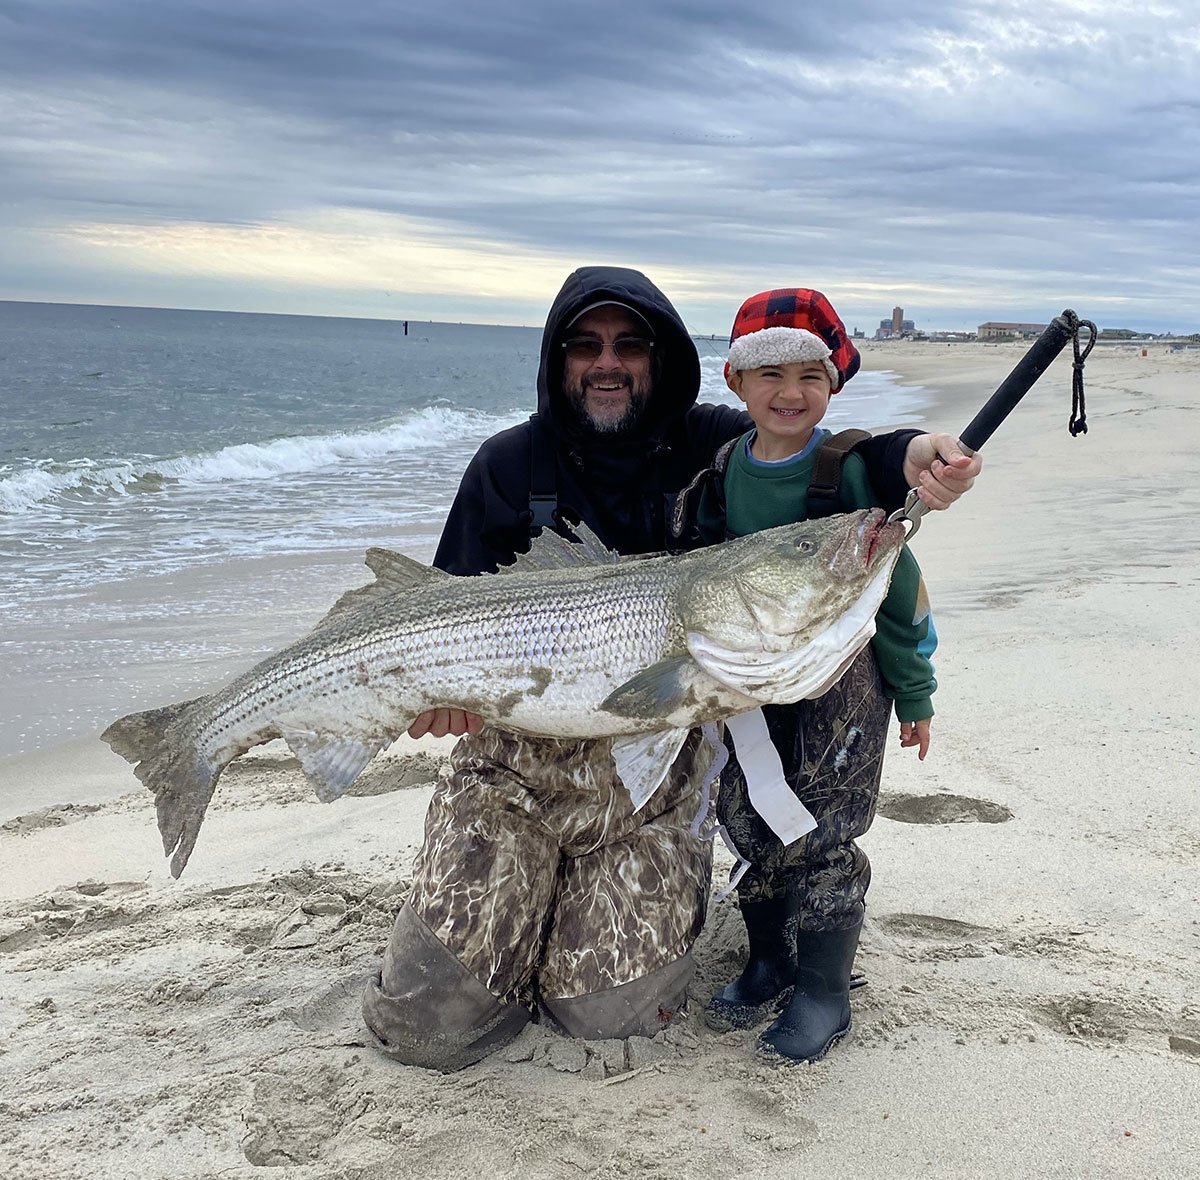
Taking notes is essential for striped bass success in school and in the surf
I run a striped bass research project at Stockton University in New Jersey where my students tag and sample stripers so that we can get a better understanding of their migration habits and population profiles. Both in the lab and field, the students have many responsibilities. There is one specific task, however, that I expect them to benefit from most, as both a scientist and an angler: and that’s keeping a logbook.
I learned how valuable this art was from reading works of great surfcasters before me (Frank Daignault, Alberto Knie, etc.) and with some additions, and the art of keeping logbooks has become a staple in my own surfcasting career.
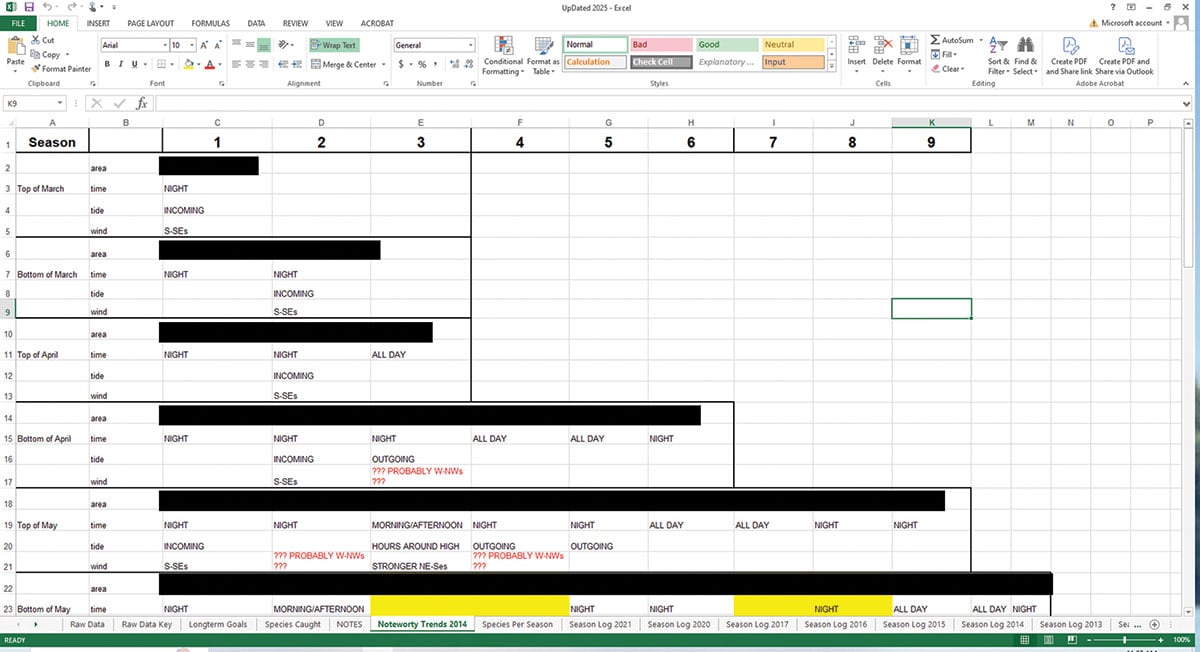
Logbooks, like lab notebooks, are detailed accounts of any/all variables involved in a process being undertaken. A properly kept fishing log should give the reader a clear visualization recall to the same scenario and conditions in which the angler caught (or didn’t), which additional information and speculation as to the reasons for such an outcome. This requires a logbook to possess many recorded variables and key observations about an outing.

Environmental Variables
Water temperature is one of the biggest drivers – if not the biggest – when it comes to fish movements and feeding behavior. In a previous edition of The Fisherman I had expounded on how all animals, even fish, having specific temperature ranges, where the middle of their temperature range illicit optimal activity. The Northeast fish species that we chase are no exception. Monitoring your targeted areas’ water temp is vital to knowing when to exploit them. It also imperative to record water temperature fluctuations at your spots as well, as even transient minor changes can affect fish feeding behavior.

A great example of this can be what I term temperature-plunge lockjaw. This is where an insane bass bite can completely die from a steep temperature drop, despite the final temperature still being within the normal feeding range. It was through recorded temp data, integrated with associated variables that I was able to reflectively understand this the first time I experienced it and how to anticipate it again.
Certain spots, that may seem like exceptions to the aforementioned temperature range guidelines, only seem that way due to a variety of additional factors. Their water temperature may be more sensitive to sunlight and wind, artificial warm water outflows, depth or shallowness, color of bottom contour, etc. As such, it is vital to record temp data and tease out a better understanding on the water temperature variability and sensitivity for each spot. To this end, refer to the USGS stations or other reputable buoys. Because some spots are too distant from buoys for precise data readings, I carry my own thermometer that I clip to my wading belt. Measurements from each (buoy and personal) should be taken and logged, and at the same daily times to minimize variability across data.
Wind Is A Factor
Both wind direction and speed are also critical factors to record. Wind affects fish movements directly but also indirectly through influencing baitfish behavior. The phrase ‘west is best’ has been recently popularized to describe the best conditions for Jersey Shore bunker blitzes, but that correlation was illuminated and reinforced in my logbooks 22 years ago. The same can be often be said when winds are blowing offshore from the north along the east-west beaches of Long Island’s South Shore and up along the New England coast.
Wind speed can also affect castability and comfort in certain spots. For example, a hard north wind may be troublesome on an inlet’s south jetty, where it can actually be advantageous on a north side of that particular inlet. The same can be said for easterly winds along the New York and New England coastline. Also, sometimes a strong enough wind can influence the exposure/submergence of bottom structure (like the way tides do) just by pushing water.
Tides & Current
Tides, moon phase, water height, and current speed are not the exact same thing, but are inextricably linked, essential elements to record in a logbook. They also vary slightly in their association with each other across spots and times, making it all the more important to keep track as to seek out patterns. The moon is solely responsible for driving the tidal cycles, and the phase of the moon affects the degree of the tidal change. The highest highs, lowest lows, and greatest amounts of current between tides are seen during the new moon and full moon. These particular tides are called ‘spring tides,’ The ‘neap tides’ are the opposite with the lowest highs, highest lows, and least amount of current.
Current is an important ingredient for many opportunistic predators like striped bass, but too much in certain spots can make lure presentation challenging and, at times, can even make landing a fish difficult. That optimal current range differs across spots, and so must be recorded and studied for each.
Many anglers pay homage to the wind, tides, and moon phases. However, these all influence another factor that should be recorded which is often neglected by even experienced surfcasters, and that’s water height. Even with all factors as beneficial as possible, if the water height is not within a certain range for particular spots the bite may be off. Fish need enough volume of water to hide in their little niches for feeding time. Also, water height effects the practicality of anglers’ casting stances. Water height can be affected by weather too.
General weather conditions need to be recorded as well. These include cloud cover, precipitation, and pressure changes. For example, pressure changes and precipitation can affect the water height, temp, clarity, and current. The brightness of a full moon can shy ambush predators away from feeding, but I have plenty of logbook instances of where this was negated by cloud cover. Logs also demonstrate that, in early season, a lack of cloud cover allows the sun to more rapidly warm up flats to proper feeding temperatures.

Seasonal & Temporal
Falling snow, like cold rain, can drop the water temperature. However, snow buildup at distant locales is an inconspicuous but extremely important variable, especially for early season casters. Recall my mention of temperature-plunge lockjaw; this does not only occur on days where the air temperature first plummets. Paradoxically to new anglers, this can also happen on very hot days. If you’re fishing a far back bay or a river mouth, but miles inland where there is a large buildup of snow from past storms, then the snow melt from the hot air will plummet the water temperature for days. Many anglers may not recognize the association of these variables (water temperature and distant snow buildup) after experiencing the devastating effects on their fishing. It is only through reflection after diligent record keeping that such a phenomenon may be revealed and understood. And once understood, the effects of similar scenarios can be anticipated in the future, backup plans made, and resources and time more wisely used.
The time of day when one has bites (or gets skunked) is an important variable. Early in the spring and late in the fall, a clear day’s sun can bring water temps temporarily into the feeding range by afternoon; and the reverse for late spring and early fall. Rainfall, another variable of note, not only influences water temp and clarity, but also current in rivers and back bays.
Other seasonal lead-ups that should be noted even before your outing are the general pre-season conditions. Prolonged extreme air temps, like the cold winter of 2025, could delay the arrival/activity of fish by a week or two. Testament is the stark contrast between when trophy stripers started their feed after the warm winter of 2023 when compared to the bitter-cold in 2025. Largescale bait movements preceding a season should tallied because these affect fish arrival times.
A great example of how preceding weather patterns and bait movements can influence the arrival of trophy bass comes when comparing the fall of 2022 and 2023 to the fall of 2024 at the Jersey Shore. Each of those two prior seasons prior began with weeklong nor’easters, followed by prolonged westerlies that pulled bunker into shore, nosing up against the wind. This was soon followed by many cow blitzes. In the fall of ’24 by contrast, the run began with strong south winds and very few bunker. As such this author was relegated back to nighttime grinding to subdue the few rouge trophies that were around as the blitz conditions didn’t really materialize until early November.
An angler can prepare better if realizing such patterns, which will be illuminated by the logbook.
Socially Tactical
Overlooked variables which can be just as vital are crowds, closure times for particular spots, plug/bait presentation, angler stance, and structural obstacles. Positioning (or stance; this rock or hole vs. another) is not only important to comfortability and longevity, but also for effectively landing a fish. This variable overlaps with any structural hindrances that should also be noted. For example, in 2024 I had a 30-pound on until about 15 feet from shore. Then, on its last drive, it sliced me off on an unseen obstruction. I made note in my logbook that if forced to utilize that same stance again, I’d have to first make sure any beast bass was totally spent 20 feet or more out before the final landing procedure. As a result I proceeded to land multiple 30s and 40s by paying attention and respect to that hidden structure and having a proper landing plan.
Plugs/bait presentation needs recording too. The choice of lure is of obvious importance to record, but so is how and where you work it. Same goes with bait. At certain times fish may prefer bunker heads whilst other times chunks. Even my hook placement in bunker heads alone varies across location/conditions, which is a result of logbook notes.
Some spots, like parks and certain beaches, have specific closure times to remember. Even ones constantly accessible can get saturated by crowds. Both variables can influence an angler’s accessibility and productivity, which is why patterns of each should be recorded.
Assimilating all the logbook information can be done in your mind (only if repeatedly read to exhaustion), summary sheets, and/or graphs. Some statistical analysis can be run (i.e. T-test or chi-square analysis) to compare correlations across variables, but the goal is to recognize connections and patterns from the data. Again, this is why it’s critical that the variables of the bad (skunked) days were also recorded, not just those of the rewarding trips. The bad trips provide points of comparison and reveal misleading trends.
My temperature-plunge lockjaw mention is a great example of how multiple factors, which differ even across locations, can be integrated together for a better understanding of events. The better the understanding of past events will allow an angler to better predict events and their effects, and thus plan accordingly.
Temporary information can be written or saved on your phone, but that information should be transferred to your master logbook ASAP. My master logbooks used to be on pads and paper, but at some point along the way I transferred to digital. Excel files allow for backups to be saved, and reduce the chance of losing the logbook, or worse (having it taken/seen).
When doing it electronically, you can also password-encrypt a digital logbook. After all, with all the work I put into fishing, data-collection, and analysis, I want my logbook safeguarded from the prying eyes of other anglers.
The author is associate professor of biology at Stockton University and has a Ph.D. in Molecular Biology and Genetics. He’s also an avid surfcaster who spends as much of his time in the field chasing striped bass from the Chesapeake to New England as he does in the actual classroom.