Kick by the fire and begin your 2024 reconnaissance.
When the bite is off, or unfavorable weather conditions prevail, alternative fishing spots identified in advance can save a day of fishing. With this in mind, wintertime is the perfect time to sit down by the fire with your laptop or tablet and scout out some new fishing spots for the season ahead. Online hydrographic and bathymetric resources available from the National Oceanic and Atmospheric Administration (NOAA) provide valuable aids for finding and characterizing bottom structure.
Below we will review BDV data displays and discuss how to access hydrographic survey field reports that provide the information used for updating nautical charts including findings about wrecks and obstructions. The objective is to provide practical insight into the use of these online resources to expand our local knowledge about where to look for fish.
What Is BDV?
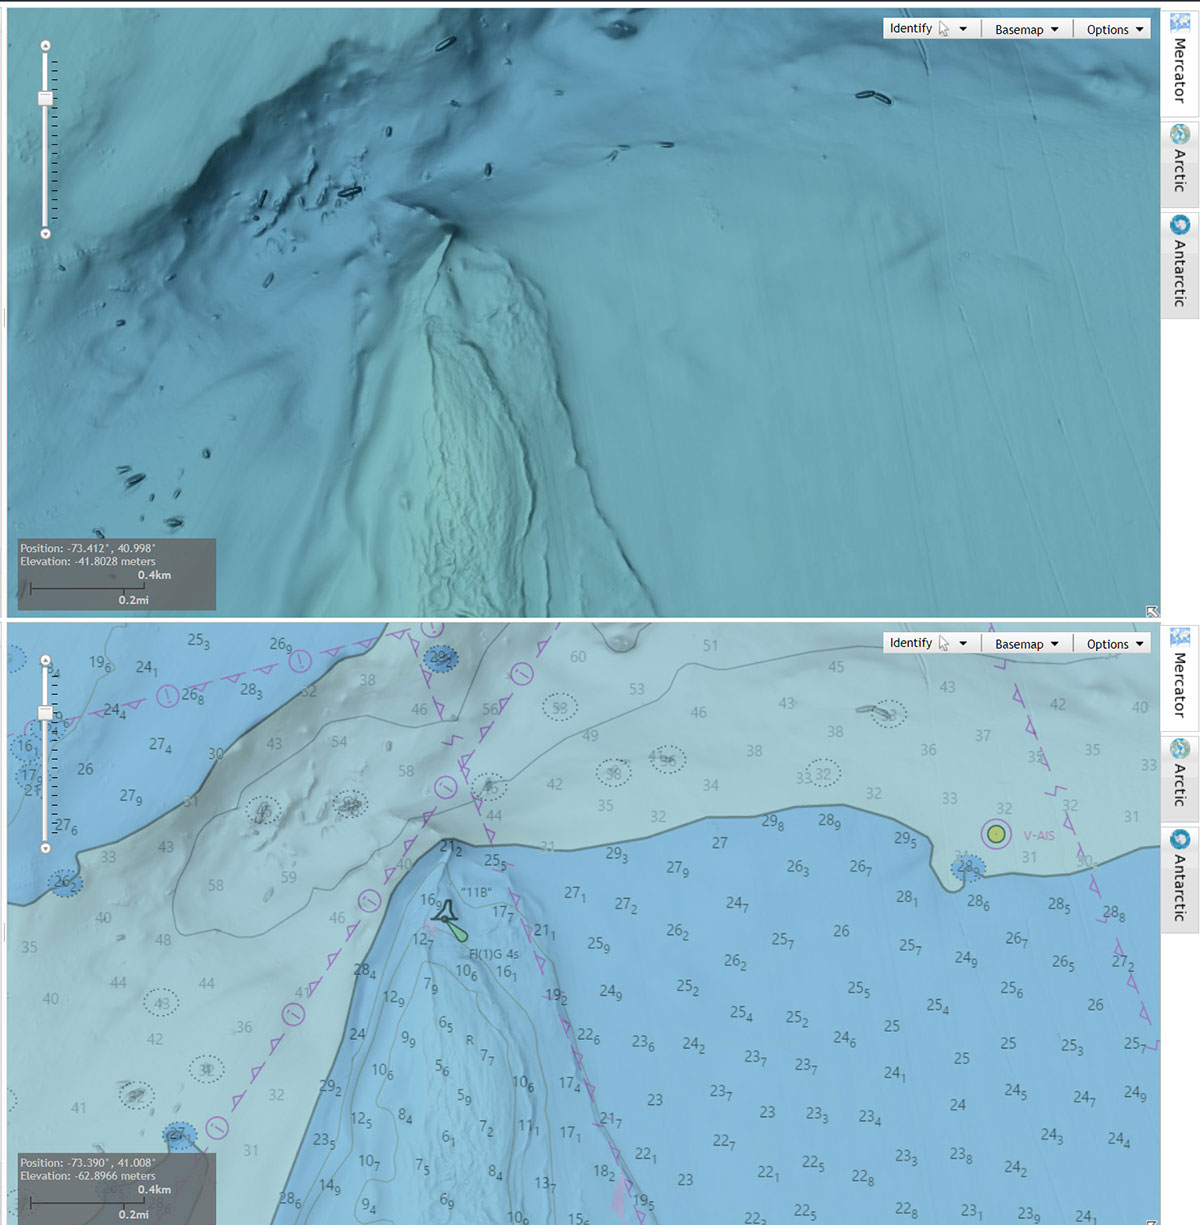
To access the BDV, which is maintained by NOAA’s National Centers for Environmental Information (NCEI), simply type “Bathymetric Data Viewer” into your Internet browser to call up a link to the website. Once you’re into the BDV application, color-shaded relief images of modest-definition sonar data and modeled sounding data are available using its Digital Elevation Models (DEM) Color Shaded Relief data layer. “DEM” images provide a generalized three-dimensional-like view of bottom contours. Locations of high and low contours and anomalies (structural features), which display as small mounds, can be determined.
The Bathymetric Attributed Grid (BAG) Color Shaded Relief data layer is also accessible using the BDV. It produces side-scan sonar-like coverage without a sonar shadow or uncovered center cones. This treatment provides a more definitive three-dimensional-like view of bottom structures than do “DEM” images. “BAGs” are derived from multibeam sonar data collected during National Ocean Service (NOS) hydrographic surveys, but area-wide coverage is partial. (NOS was previously the National Ocean Survey, and before that the U.S. Coast and Geodetic Survey.) “BAG” image definition is sufficient to flag attention to rugged features and characterized them as wrecks under about 35 feet in depth.

The images become pixelated (i.e., grainier) the deeper the structure. “BAG” modest definition sonar image coverage is robust for some coastal areas, but not so much for others. For New England, there are holes in the coverage here and there, but most of the bottom has been surveyed from western Long Island Sound, through Rhode Island, into Buzzards Bay, around and south of Martha’s Vineyard and Nantucket and most of Cape Cod Bay and the Gulf of Maine are available.
Many, but by no means all, bottom structures are charted. Not all features are shown on nautical charts, including some wrecks and obstructions that are recorded in the NOAA Coast Survey’s Automated Wreck and Obstruction Information System (AWOIS) and Electronic Navigational Chart (ENC) data base. AWOIS and ENC data can be viewed online using the Coast Survey’s Interactive AWOIS Map. Correlate screen data shown by this map with the BDV display of “DEM” and “BAG” color shaded relief images to find charted and uncharted features.
Step By Step
Use the following steps to access the BDV. The home screen opens with multibeam tracklines and hydrographic survey locations shown. Declutter the screen by off-clicking “Multibeam Survey Tracklines” and “NOAA NOS Hydrographic Data”. Also, make the navigation box in the lower right-hand corner disappear by clicking the arrow at the lower right corner. Then click on the “Options” drop-down box in the upper right-hand corner of the screen. Click off the “Boundaries/Labels” box. Click on “NOAA Electronic Navigational Charts (ENC®)” to overlay a see-through nautical chart. Make the map display large horizontally by clicking on the boundary line with the image and dragging it left.
As a technical sidebar, the BDV formerly used a Raster Navigational Chart (RNC) as its basemap. This was changed to an ENC basemap in late 2021. The full-color palette that was used for both the “DEM” and “BAG” data layers was changed to a blue-tone palette in early 2023. NOAA’s objective was to make the display friendlier for color-impaired users. However, the result made it more difficult to discern bathymetric changes for the rest of us. The issue was brought to NOAA’s attention for consideration.
Users get to the “BAG” and “DEM” Color Shaded Relief images by zooming in using the zoom scale in the left corner of the BDV map. Then, click on the “BAG Color Shaded Relief” box to call up the side-scan-like sonar images. Click on “DEM Color Shaded Relief” to call up modeled sounding data. Each may be on separately or combined. When on together, the DEM image fills in areas where BAG coverage isn’t available.
Leave the “BAG Color Shaded Relief box on and click on “NOAA NOS Hydrographic Data” and “Surveys with Bathymetric Attributed Grids (BAGS)” (formerly “BAG Footprints”). This calls up purple outlines of areas and in some cases individual spots that were surveyed. Place the cursor over an area where there is a BAG image and single tap the image. This generates a pop-up box with “Identified Features”. Click on the “Surveys with BAGs” in the pop-up box.
Placing the cursor on a survey name and clicking calls up a Link to Data” pop-up box. Click on “Link to Data”. Next, look to the ‘Survey Products’ box and you may find a PDF that gives a full NOS descriptive report for that survey. Some will include additional imaging, including sidescan-like images, that can really help you gain a full understanding of what lies below the surface. These reports may also contain additional information about other wrecks and obstructions within the survey area.
A Deeper Data Dive
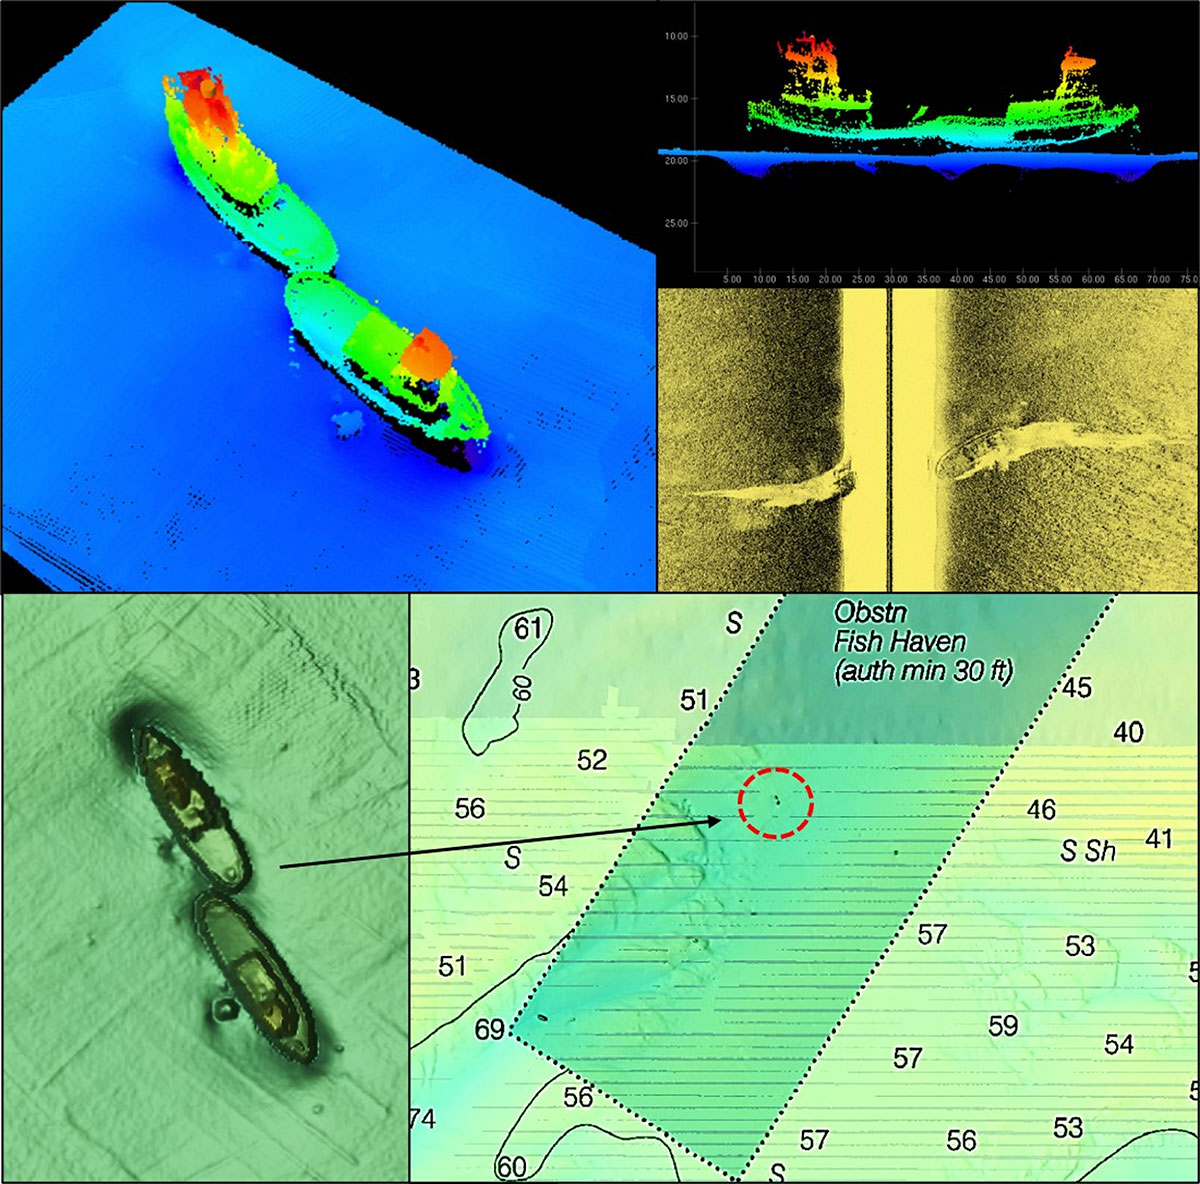
You’ll find hundreds of wrecks on these surveys, but not all of them have been explored by NOAA. I fish mostly in New Jersey and several of the wrecks inside the lower third of the Cape May Fish Haven – a series of artificial reefs – have AWOIS numbers and were investigated during the NOS 2013 field survey. They were featured in the DR along with multibeam and side-scan sonar images. Two tugs that were sunk as artificial reefs (see image) which also shows how the wrecks are displayed using the BDV “BAG” Color Shaded Relief image.
Results of field surveys performed or contracted by NOS and agency predecessors are documented by DRs. Most surveys were commissioned to inform nautical chart updates, while others were commissioned to assess bottom conditions for other purposes, such as determining conditions at locations proposed for placement of dredged material or establishment of offshore windfarms. DR content typically includes verification and correction of charted depths, investigation of specific wrecks and obstructions, assessment of bottom composition, and investigation and reporting of uncharted wrecks and obstructions found by field surveyors.
DRs are – with few exceptions – not historic research surveys, however they routinely collect data about historic features. Although historic information was included in earlier DRs, modern DRs are focused towards hydrographic data. So, for historical background, we need to look for other sources. A productive practice is to consult wreck research and diver published materials and websites. One that readers might enjoy researching is www.wreckhunter.net, when available, this site will offer all kinds of information about the boat, including photos and will also include information about location, current condition as well as historical data including cause of the accident and even the boat builder.
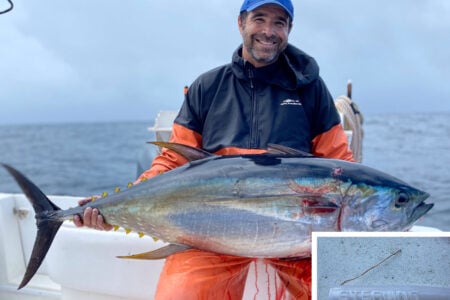
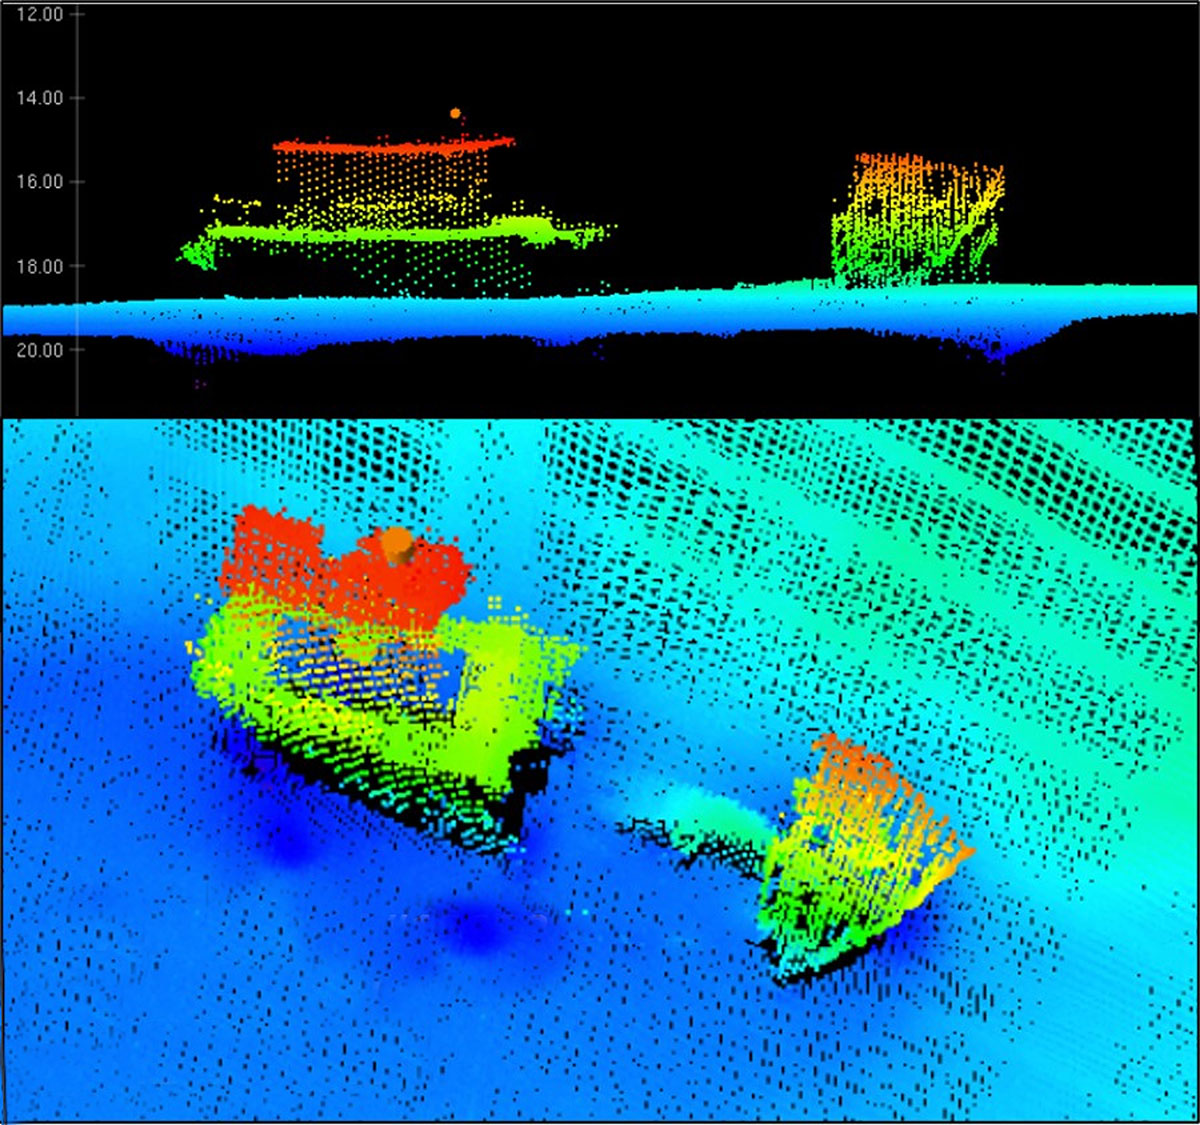
Many DRs produced over the past decade do include detailed images of featured bottom structures using multibeam sonar data. Some of the DRs, especially more recent ones, illustrate selected “features” using side-scan sonar and color imaging of multibeam sonar data. These images, some of which are three-dimensional, show a different aspect of the structure. This is sometimes helpful for better characterizing what it is and how it is configured. You can see an example in the image of the sunken trawler, shown as a multibeam sonar example accompanying this article; the bow section is broken off, with both sections sitting upright on the bottom—that kind of information just wasn’t available before.
DR report formats have consistent general structure, but content presentation varies. Imaging also varies between reports and contractors that were used for field survey work. DR data are localized as are chart excerpts. Some include wide-area charts to aid in pinpointing charted locations, although most don’t. Nevertheless, the data are a fundamental resource for chart updates as well as for the advanced armchair scouting of fishable structure.
Working through the data can sometimes get tedious; but, there are data nuggets worth finding to better understand specific structures and to inform the selection of fishing tackle and tactics. Readers can access DRs online using BDV switches and boxes as discussed previously. Check the Help line on the left side of the BDV screen for details.
NOAA sonar data and fields reports are convenient, powerful, and valuable references. However, the data are far from complete. Therefore, we need to look elsewhere for insights about specific bottom structures. Online scouting resources like dive community websites can help fill in the gaps. Also check AWOIS, YouTube videos, academic research papers and images, relevant Facebook groups, and Eastern Search & Survey’s online Google Map with high definition side-scan sonar shipwreck images.
Commercial applications such as the Navionics Boating HD Marine & Lakes smartphone application provide sonar charts with and without color relief shading. Note that the Navionics app uses a full-color palette for bathymetric relief data.