Researchers may hold the key to the future of striped bass, but you can help.
I define tagging as the use of an information label or tracking device to collect data on an organism’s net movements, detailed movements, location/temperature preferences, and growth rates. This broad definition incorporates simplistic types of tags – like the dart, spaghetti, or circular clip styles – as well as sophisticated acoustic and satellite tags.
The information provided by any type of tagging method increases our collective understanding of a species. Valuable hints regarding a fish’s population health or behavior inform policy decisions and seasonal regulations, while invigorating the community’s appreciation for the species. These reasons drive my collaboration with multiple tagging projects, each dealing with varying levels of data complexity.
The front end of a tagging endeavor (fishing, catching, tag application, and a safe release) requires a degree of angling experience. As a long-time trophy bass angler, I have had that front confidently covered. The mid-to-tail end of a tagging project deals with data organization, categorization, statistical analysis, interpretation, and reflection on future study refinements. This part is more complicated, especially for a Ph.D. whose degree is in molecular biology and cancer research rather than fisheries science. It feels as though I’m in the deep end at times. Still, I love these fish and know the benefit to them of properly analyzing these tagging data for peer review in the scientific community. I am proud to recruit help, which is a key purpose of this article.
Anglers assisting in any striped bass tagging endeavor are invaluable and have my personal thanks. You make the front end of the process robust and lively. The mid-to-tail end is what needs extra attention, and such work cannot come from individuals with only angling experience. Some anglers reading this are also scientists, researchers, and statisticians. Your involvement and contribution are needed. Jump onboard with a tagging program to provide insight or lead the number crunching. Collaborations could benefit you with professional connections and an eventual peer-reviewed paper. Now let’s dive into the different types of tags, tagging programs, and what the latest data show.
Straight & Circular Tags
On the less expensive end of tag types are straight and circular tags. All feature contact information for the tagging organization and a specific tag ID number. When an angler catches a tagged fish, they contact the organization and report that ID number. In exchange for updated information on the fish (length, general location recaptured, and date), the organization typically provides the angler with the history of when that specific fish was last caught, at what size, and where. That info is an incentive for any recapturing angler to make contact. Furthermore, depending on the organization, sending in a recapture can win prizes like hats, certificates, and monetary rewards. Getting involved on the front end is easy, as most tagging organizations are open to public participation.
These types of tags are affordable, easy to store, and simple to use. An example of a straight tag is the dart type, which has a plastic prong at its end designed to latch into the meat of the fish once inserted. Circular tag types include clip tags (the ends clip together after application to ensure anchorage) and spaghetti tags (which require tying the ends together to secure the tag). Both types must penetrate completely through a thin piece of flesh on the fish. The anatomical site of tag application varies with species, but it is usually on the posterior half of the upper back.
Using dart, circular, and spaghetti tags, the American Littoral Society has run a tagging campaign for decades. For a few years, I have incorporated their circular clip tags into my undergraduate research project at Stockton University in New Jersey. My students apply them mainly to striped bass and summer flounder, but also tautog and sheepshead. The information we hope to gain on future tag returns will augment other Stockton-based endeavors meant to gain a better understanding of these species. For example, the Striped Bass Tagging for Stockton project involves scale- and tissue-sampling of the fish. These samples allow for age assessment and analysis of spawning grounds of origin through DNA sequencing. Students also keep logbooks on catch variables, highlighting changing patterns in the feeding behavior of the local striper population.
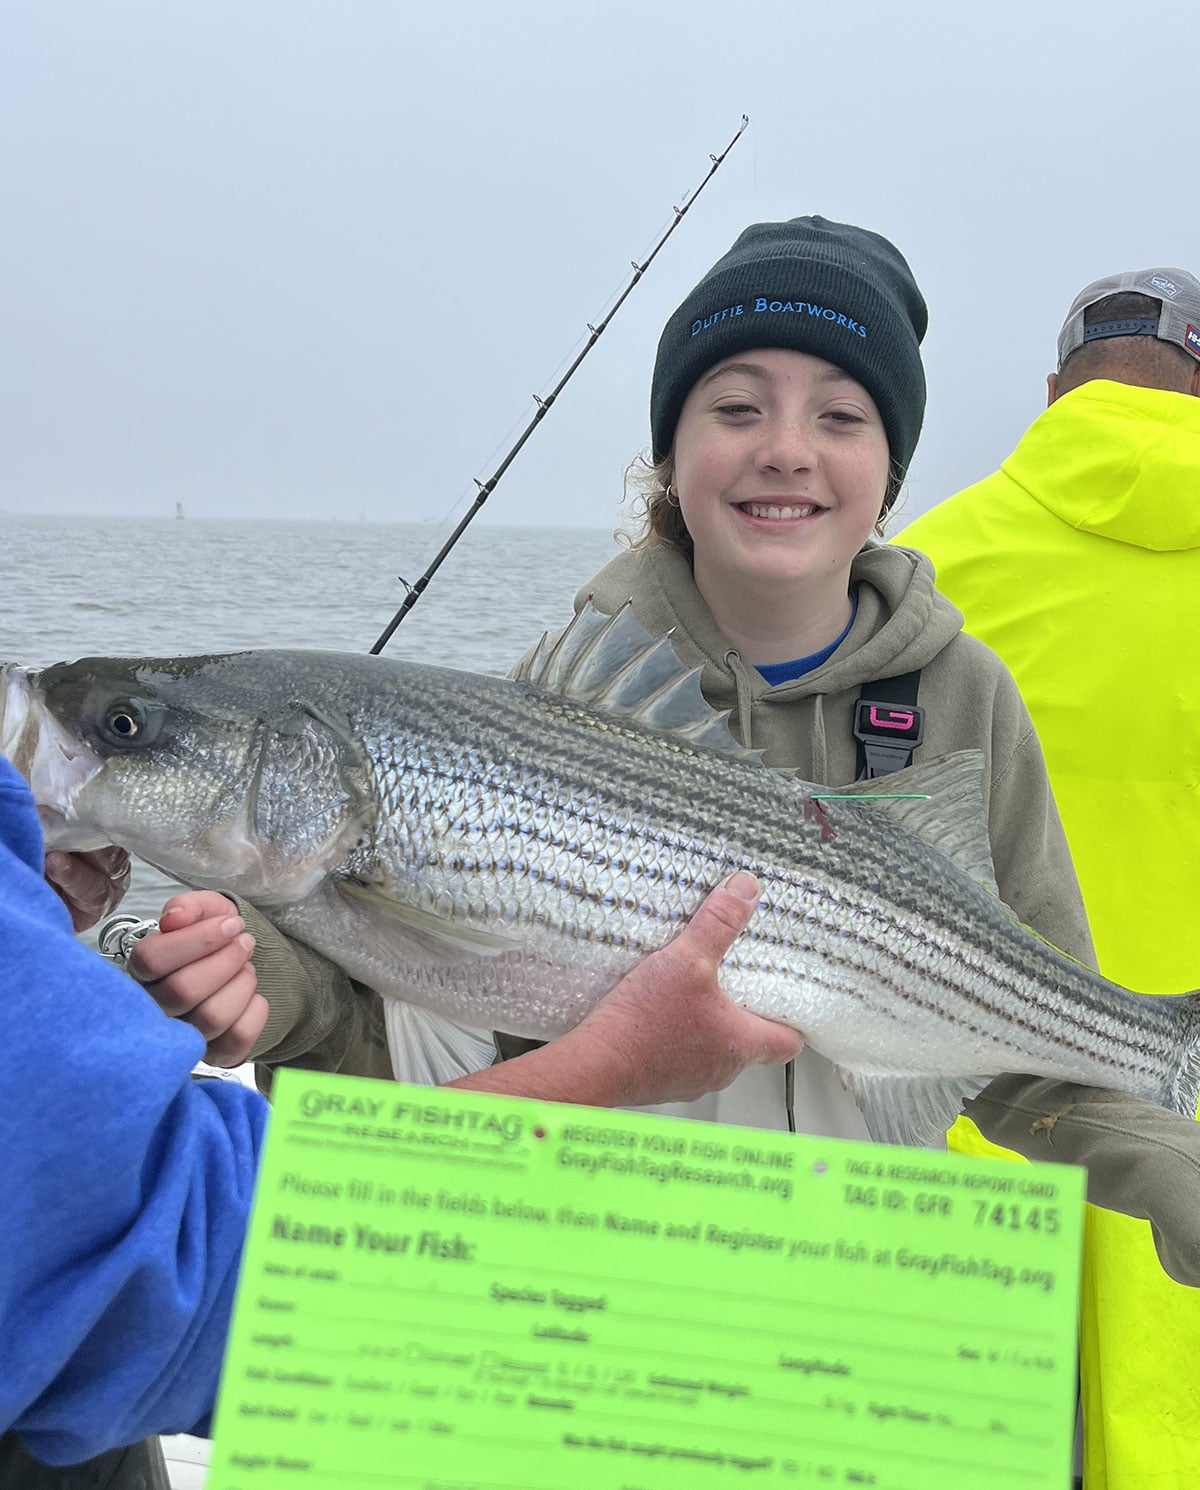
Gray FishTag Research has applied various tagging modalities for years across the globe. They focus on a multitude of species, including cobia, drum, roosterfish, halibut, and many types of sharks and pelagic species. Their streamer tags are a green type of dart tag that’s easy to manufacture and insert. Currently, over 76,000 have been implanted in released fish, with over 7,300 used in the Northeast Striped Bass study. Over 300 of these have been recaptured. Though this recapture rate is roughly 4 to 5%, the data provide valuable insights into post-release survival rates and growth.
A limitation of these simpler tags is that only net information on the individual fish is gathered. Fish don’t usually migrate in straight lines. The net distance a fish travels from point A to point B involves turns, stops, and potential backtracking that a simpler tag type cannot detect. Digital tags, however, provide details on fish movements alongside data like water temperature and depth changes.
Acoustic & Satellite Tags
Acoustic and satellite tags are digital tagging methodologies essential for scientists studying marine organisms. Acoustic tags require a network of localized underwater receivers to record data. The tags emit high-frequency “pings” containing a unique digital code. When the fish swims within range (usually a few hundred meters) of a receiver, the station logs the date, time, and specific animal ID. Satellite tags are larger and bulkier, but their use is not restricted to localized areas. Instead of using sound waves underwater, they use radio waves to transmit data directly to orbiting satellites, circumventing geological boundaries.
There are trade-offs to each device. Acoustic tags are less expensive, small, longer-lasting (5 to 10 years in some fish), and will feed back high-resolution data for precise movement tracking. However, they are confined to localized areas and are not applicable for monitoring long-range species migrations. The larger satellite tags cost thousands of dollars more, stay anchored to a fish for only a quarter or even an eighth of the duration, and provide lower-resolution data by estimating paths over large regions. Because satellite tags don’t rely on underwater receivers, they track fish over great distances. These tag types are complementary, since both help form a better understanding of migratory behavior.
Prior satellite tracking studies on striped bass primarily focused on small, non-spawning fish in localized environments like the Chesapeake Bay, largely ignoring the big, open-ocean migratory stocks that anglers target along the coast. Before modern research programs kicked off, there were virtually no published satellite telemetry studies tracking the movements of large, multi-stock coastal striped bass. This lack of data left scientists and fisheries managers in the dark about the offshore habits of mature, ocean-going “jumbo” stripers.
While acoustic tagging studies did provide some sparse data closer to the beach, the technology was limited by the need for stationary underwater receiver networks. These early efforts missed the grander, open-ocean migrations that occur far beyond the surf line. As a result, decades of tracking research overlooked the vast migratory highways and offshore behavior of the ocean’s largest striped bass populations.
Northeast Striped Bass Study
Gray FishTag Research and Wildlife Computers have implanted striped bass with satellite tags since 2019. This Northeast Striped Bass study uses two main types of sat tags: the miniPAT (used on larger bass) and the newer microPAT (used on smaller bass). Both gather information on light-based geolocation, time-at-depth profiles, and water temperature data. The former data requires full device retrieval after it detaches from the host fish at a pre-set time (typically 5 months). Other data is sent remotely. To date, 33 sat tags have been deployed on striped bass, with 16 physically retrieved. Not all of these represented the Northeast’s mixed migratory stock, as a few were tagged over winter in the lower Chesapeake. Examination of their route habits during migration relegates the current usable pool to the 13 tagged off the Jersey Shore in late spring.
Jim Hutchinson’s November, 2025 article (Striper Tag #1: An Early ‘25 Return) in The Fisherman was a great recap on some of the individual fish. He noted how a fish named Liberty’s travels and depth, where she dove multiple times beyond 50 feet, and Freedom’s great distance offshore, according to the stored data. More broadly, it seemed, that most of the tagged bass were using the eastern parts of the Nantucket Shoals as a summertime aggregation area. At the time, however, no descriptive statistics were run on this fish against and across the others.
Minimizing the available pool for analysis even further, data on fish Navionics and Yo-Zuri were lacking, so the cross-fish analysis had to be performed on 11 of the tag returns. Ideally, a larger sample size is better to draw conclusions. Results would be more reliable, offering increased confidence in data interpretation. This is a trade-off of sophisticated, mass-data-collecting satellite tags. They gather exorbitant amounts of data points, but because they are expensive, only a few are used at a time. This is all the more reason for more participants and sponsors to get involved in satellite tagging efforts.
Due to my lack of expertise in biostatistics, I recruited experts including doctors Dana Christensen and Tara Crowell to help analyze the data. How the system logs raw data is complex, requiring elaboration from Wildlife Computers. For me, it was like looking at another language. Once we obtained clarification on how the raw data was organized, I wanted to hone in on the three most valuable behavioral characteristics: the averages (across all 11 fish) for depth, water temperature, and geolocation-based distance offshore. Unfortunately, the last parameter (distance from shore) is based on probability cones, which are notoriously difficult to categorize and compare. Not unlike the forecast cone of a hurricane, that fish could have swum anywhere within that ‘cone of uncertainty’ the data readout plots the average.
While light-based geolocation cannot give us a pinpoint, single-number average of exactly how many miles off the beach these 11 striped bass swam, it definitively proves that these jumbo fish are utilizing a massive, deep-water migration corridor far out in federal waters. Across all 11 fully retrieved datasets, the tracking data reveals a highly consistent, population-wide pattern – upon leaving the late-spring coastal waters of New Jersey and New York, these fish bypass traditional inshore routes and head straight across the open ocean toward the deep rips of the Nantucket Shoals.
However, the data is fundamentally limited by the nature of light telemetry itself. Because the tags estimate location based on the timing of sunrise and sunset, atmospheric “noise” – like heavy cloud cover, murky water column dives, and seasonal shifts around the equinox – can cause an inherent margin of error. Rather than generating a single GPS coordinate, the software maps out mathematically calculated probability cones where the fish is most likely to be. This means while the technology is flawless at proving the macro-level reality that our biggest stripers are spending their summers inside these offshore probability zones deep in the protected Exclusive Economic Zone (EEZ), it lacks the tight precision needed to calculate an exact, day-by-day mileage distance from the sand.
| NORTHEAST STRIPED BASS STUDY |
| As it stands today, there were five satellite tags deployed by Gray Fishtag Research in 2025, and another three for the 2026 season. Learn more and help support striper tagging at grayfishtagresearch.org.
2025
2026
|
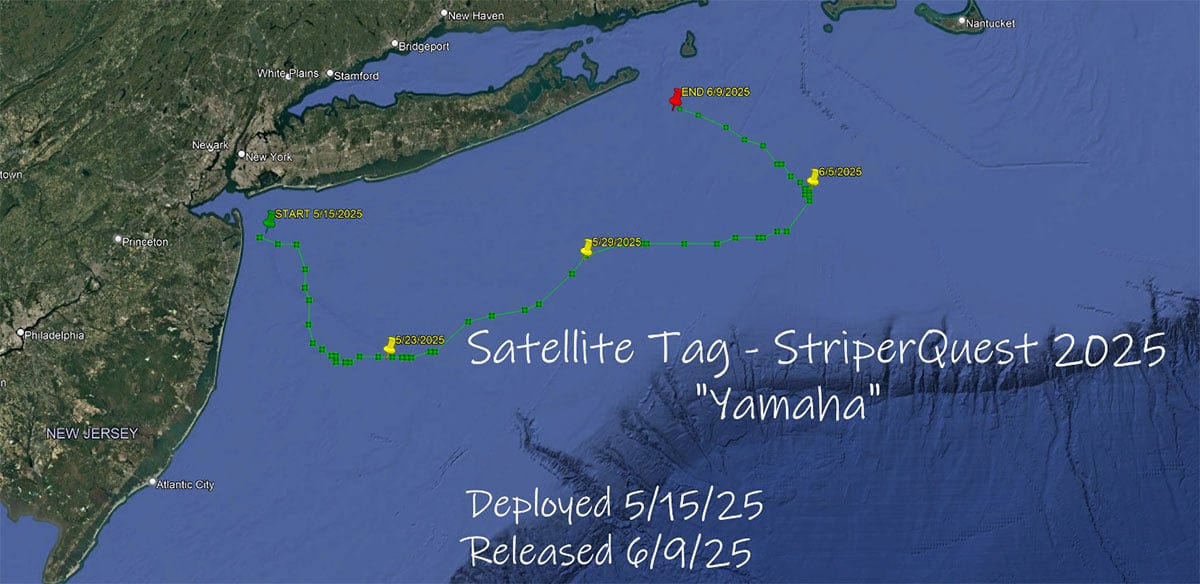
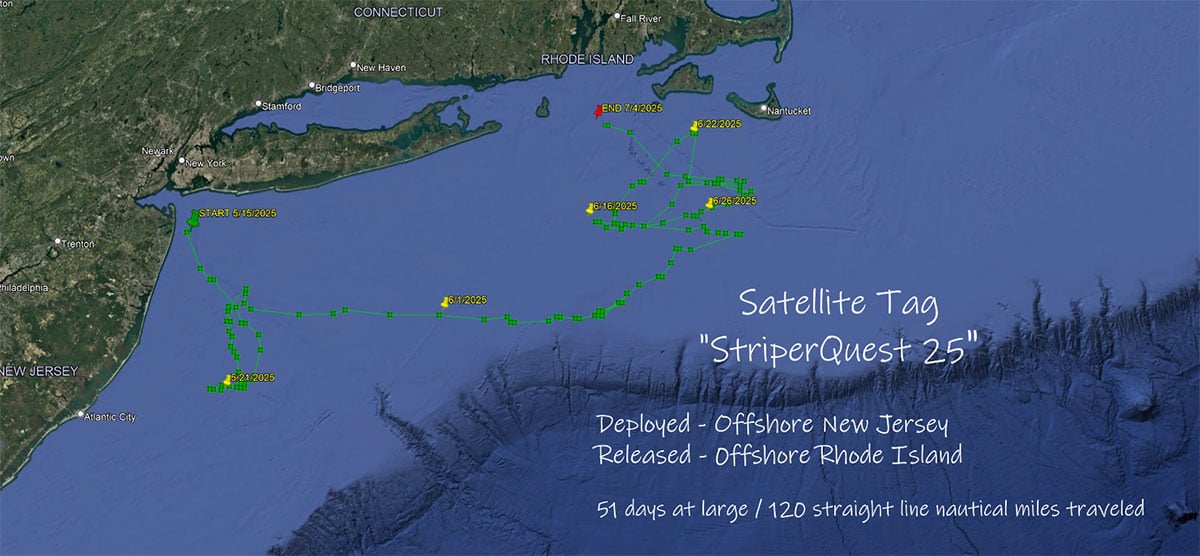
The averages of depth and water temperature still have value to investigate. Even though a sample size of only 11 fish is limited, the tagging program is growing its data pool with more fish each year. As more data comes in, we can incorporate it into the existing analyzed pool, increasing the generalizability of its conclusions.
Using SPSS software, Dr. Crowell organized and analyzed the means for 16 different variables for each of the 11 fish. Specifically, descriptive statistics were run for each fish to indicate minimum and maximum depth and accuracy; sea surface temp (as a proxy for maximum temp) and temperature minimum. These were used to generate total depth averages and total water temperature averages. An average minimum depth of 11.5 feet and an average maximum depth of 57.7 feet were used to determine a total average depth of 34.5 feet. An average minimum water temperature of 59.7 degrees and average maximum water temperature of 65.6 degrees were used to determine a total average water temperature of 62.65 degrees during this segment of their migration.
Other variables may have impact of these data points’ accuracy, but these descriptive statistics still give us a better understanding on their preferred depth and temperature ranges during migration. An additional variable of time of day (dawn vs. dusk) was collected for one fish (Hail Mary) and an independent t-test was run with time of day and depth and accuracy to determine if there were any statistically significant differences found depending what time of day the data was collected. Results reveal several differences in measurements of depth and accuracy occurred based on time of day; specifically, with higher numbers occurring during dusk.
These findings are interesting and give direction to future research. Specifically, including time of day with data collection of all fish, along with exploring if other variables could impact measurements of depth and accuracy.
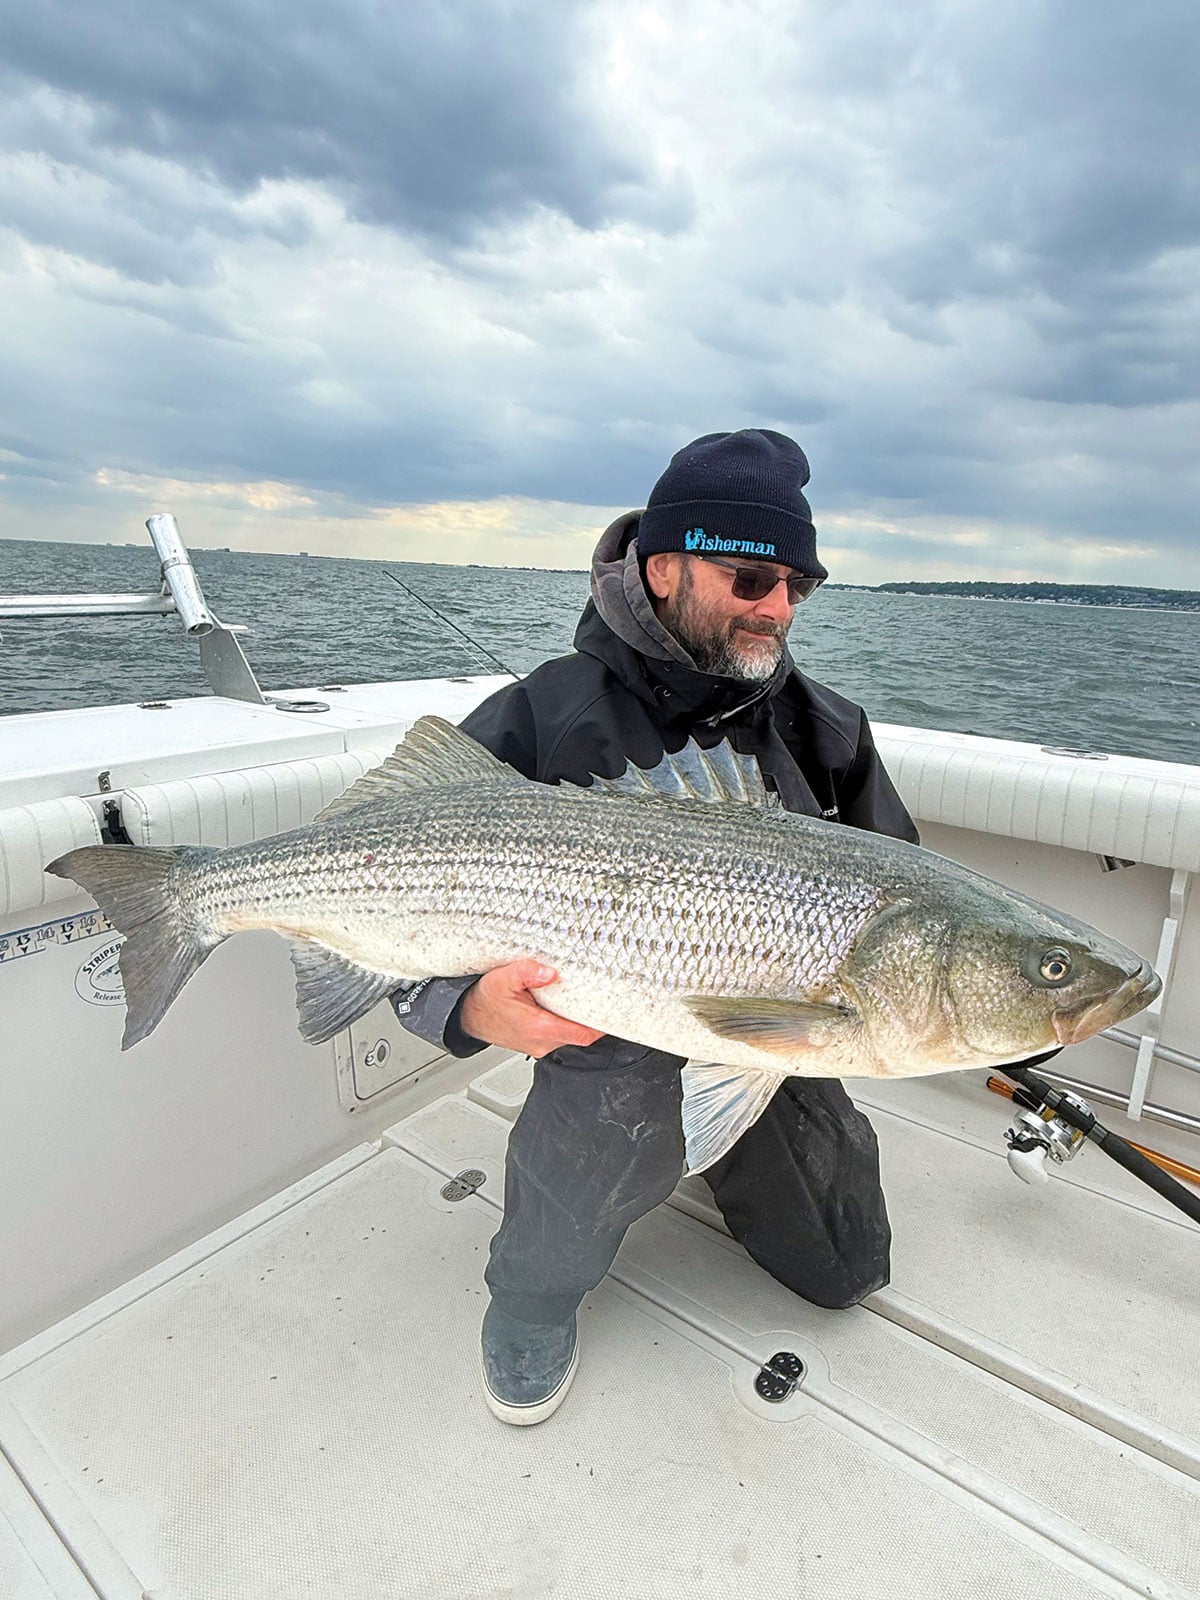
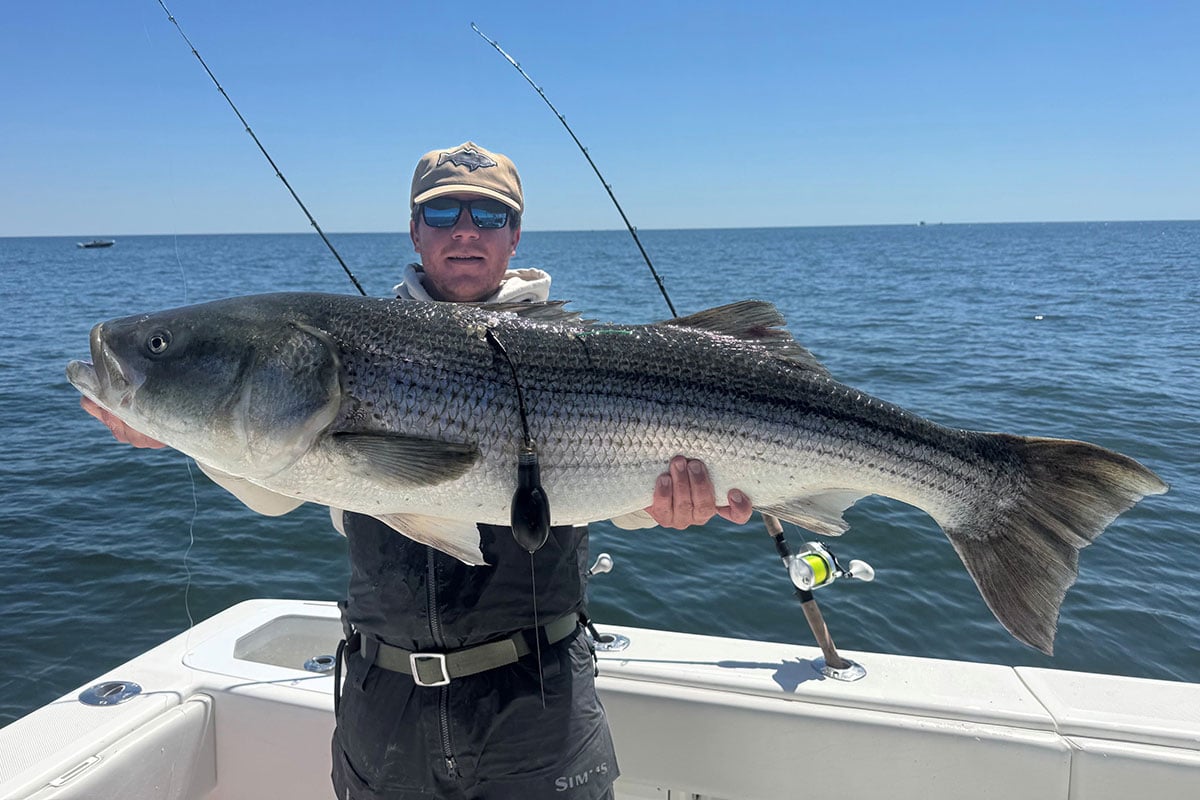
I am excited to incorporate temperature and depth data from the big bass called StriperQuest25 that I personally caught, tagged, and released on Chuck Many’s Tyman off Sea Bright, NJ. The miniPAT data revealed that the fish traveled northeast, completely bypassing parts of the expected inshore path. It swam directly to Nantucket Island, MA over the summer before making a distinct turn back west toward Rhode Island. During its summer residency at the Nantucket Shoals, StriperQuest25 spent much of its time between 17 to 32 miles completely offshore from the coast. This is one more data point supporting the idea that jumbo bass utilize a much broader, offshore migration corridor further out in the Atlantic than previously thought.
The pool of analyzable satellite and acoustic tag data needs to keep growing so that potential significant trends found will cannot be ignored regulatory bodies and policymakers. This underscores the value of expanding tagging participants and sponsors, alongside recruiting fisheries biologists and statisticians for the tail end of the process.
The author is associate professor of biology at Stockton University in New Jersey and has a Ph.D. in Molecular Biology and Genetics. He’s also an avid surfcaster who spends as much of his time in the field chasing striped bass from the Chesapeake to New England as he does in the actual classroom.